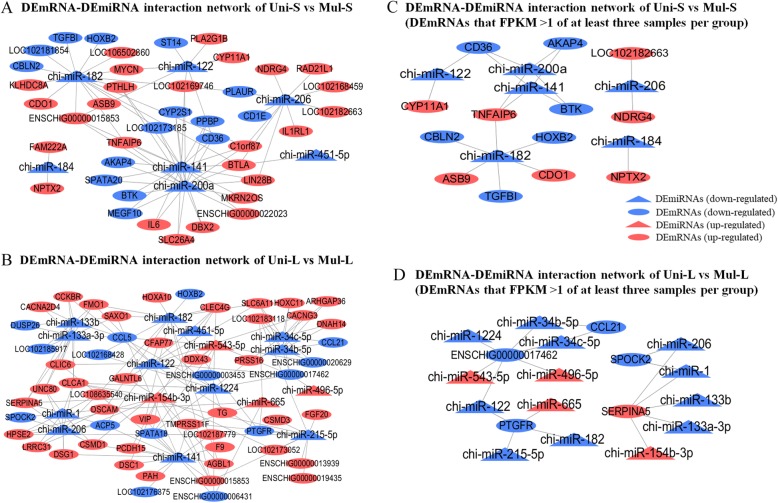
Fig. 3.
The original and selected DEmRNA-DEmiRNA interaction network of Uni-S vs Mul-S and Uni-L vs Mul-L. a The original DEmRNA-DEmiRNA interaction network of Uni-S vs Mul-S. b The original DEmRNA-DEmiRNA interaction network of Uni-L vs Mul-L. c The selected DEmRNA-DEmiRNA interaction network of Uni-S vs Mul-S. DEmRNAs were screened according to FPKM > 1 of at least three samples per group. d The selected DEmRNA-DEmiRNA interaction network of Uni-L vs Mul-L. DEmRNAs were screened according to FPKM > 1 of at least three samples per group. Ellipses and triangle represent DEmRNAs and DEmiRNAs, respectively. Red and blue colored nodes represent upregulation and downregulation, respectively

