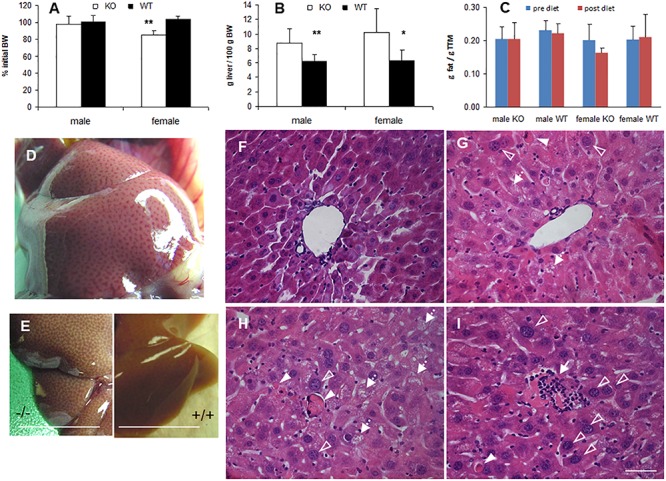
FIGURE 3.

Phenotype of phytol challenged PMP34 knockout mice. (A–C) Influence of phytol diet on male or female PMP34 knock out (KO) mice versus age matched wild type (WT) mice on body weight, expressed as % of body weight (BW) at the start of the diet (A), liver size, expressed in g/100 g BW (B), and fat mass, expressed in g/g total tissue mass (TTM) as determined by DEXA at the start and end of the diet (C). Data are represented as mean ± SD (n = 4-8 (A,B) or 3-6 (C) per gender and per genotype. The effect of phytol was statistically analyzed per gender (Oneway ANOVA **P < 0.01, *P < 0.05 KO versus WT). Heterozygous mice responded in a similar way to phytol diet as WT animals and liver size and fat mass of KO and WT did not differ on a control diet (data not shown). (D,E) Mottled appearance of liver of knockout mice on a phytol diet, as seen upon dissection of a male mouse (D) or after bleeding and removal of the liver (E; scale bar 1 cm). Similar mottling is evident in female KO mice (not shown). (F–I) H&E stained liver sections of WT (F) and KO male mice (G–I) on phytol enriched diet showing enlarged nuclei (open arrowhead), apoptotic bodies (full arrowhead), inflammation zones (arrow) and microvesicular steatosis (dashed arrow) in the phytol-fed KO mice. (F,G): portal triads; (H,I): intermediary zone of the hepatic lobule. Scale bar 50 μm.
