
Figure 6.
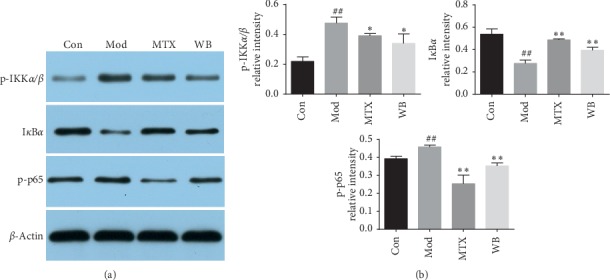
WB suppressed the activation of NF-κB in CIA mice. (a) Representative bands of western blotting in different treatment groups. (b) Semiquantitative analysis of western blotting in different treatment groups. ∗P < 0.05,∗∗P < 0.01 vs. model group. ##P < 0.01 vs. control group.