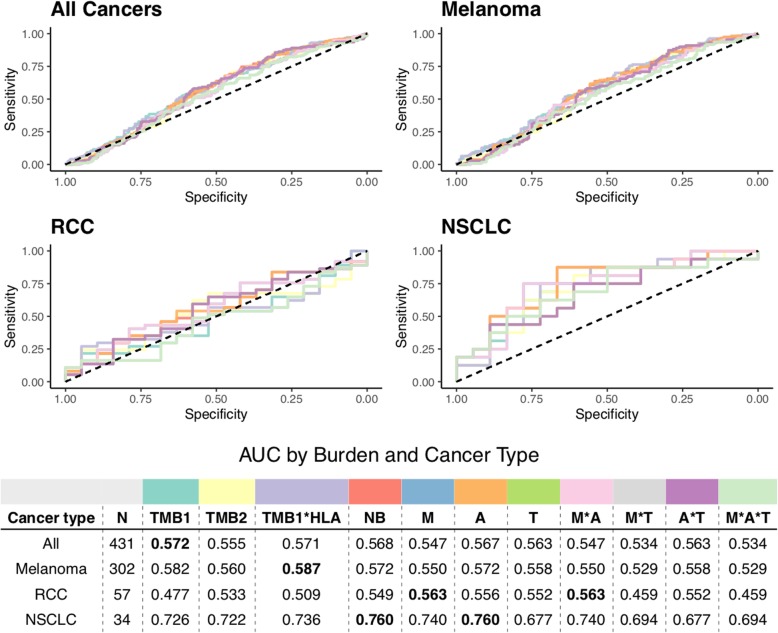
Fig. 4.
Receiver operating characteristic curves of predictive capacity of 11 different mutation/neoepitope burden metrics. The upper panels depict the true positive rate (sensitivity, y-axis) and false positive rate (1-specificity, x-axis) for each metric across all probability thresholds. The four panels represent models for four different cohorts based on different subsets of patients: All Cancers, which includes all patients, and Melanoma, RCC, and NSCLC, which include only melanoma, RCC, and NSCLC patients, respectively. The table in the lower panel reports the area under the curve (AUC) for each metric (columns) applied to a different cancer cohort (rows), with colors above the methods indicating the color of the corresponding curve in the upper panels. TMB is used as a predictor in both raw (TMB1) and coverage-adjusted (TMB2) forms, as well as in a multiplicative combination with patient HLA allele count (TMB1*HLA). Neoepitope burden (NB) is used as a predictor in both raw and extended formats (see “Methods”). Extended neoepitope burden metrics include number of amino acid mismatches (M), number of HLA alleles predicted to bind each epitope (A), and number of transcripts expressing each epitope in TCGA (T), along with their multiplicative combinations. Bold-faced values indicate the best value for each cancer cohort

