
Figure 3.
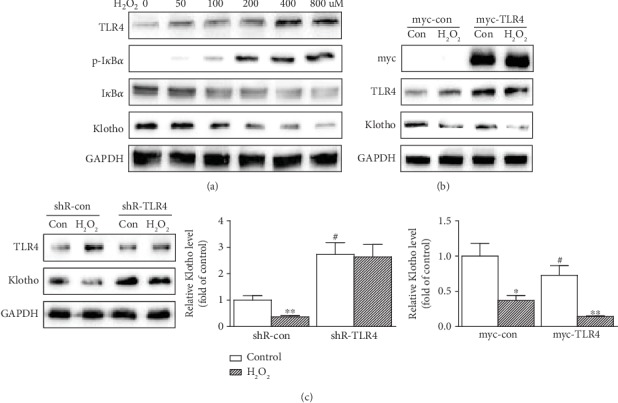
Regulation of Klotho by TLR4-NF-κB signaling in NP cells. (a) NP cells were treated with increasing amounts of H2O2 (0, 50, 100, 200, 400, and 800 μM) for 12 h, and then TLR4, p-IκBα, IκBα, and Klotho protein levels were assayed by Western blotting. (b) NP cells were transfected with control or a plasmid expressing myc-tagged TLR4 then treated with H2O2 (200 μM) for 12 h. The overexpression of myc-tagged TLR4 was verified with an anti-myc antibody. TLR4 and Klotho were assayed by Western blotting. Bar graph on right: quantifications of Figure 3(b). (c) NP cells were transfected with a control or a shRNA-TLR4 plasmid then treated with H2O2 (200 μM) for 12 h. Cell lysates were tested for TLR4 and Klotho expressions by Western blotting. Bar graph on right: quantification of Figure 3(c). GAPDH served as an internal control. The results were presented as mean ± SD of three independently performed experiments. ∗P < 0.05, ∗∗P < 0.01 vs. control. #P < 0.05 vs. shR-con or myc-con.