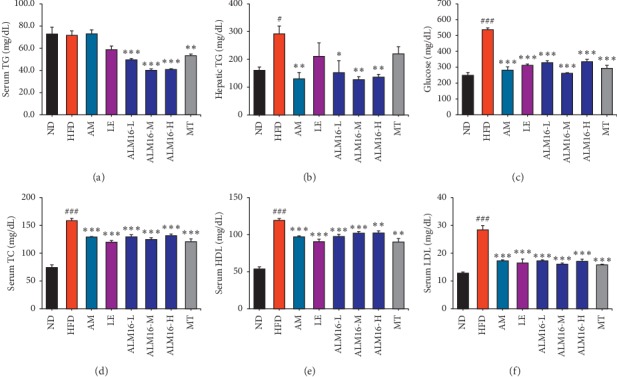
Figure 3.

Effects of ALM16 and individual extracts (AM and LE) on serum lipids and glucose levels in HFD-fed mice. (a) Serum TG and (b) hepatic TG levels. (c) Serum glucose levels. Serum levels of (d) TC, (e) HDL, and (f) LDL cholesterol in HFD-fed mice (n = 5). Values are presented as mean ± standard error of the mean (SEM). #P < 0.05, ##P < 0.01, and ###P < 0.001 vs ND group; ∗P < 0.05, ∗∗P < 0.01, and ∗∗∗P < 0.001 vs HFD group. ND: normal diet; HFD: high fat diet; AM: HFD + AM extract (100 mg/kg); LE: HFD + LE extract (100 mg/kg); ALM16-L: HFD + ALM16 (50 mg/kg); ALM16-M: HFD + ALM16 (100 mg/kg); ALM16-H: HFD + ALM16 (200 mg/kg); MT: HFD + milk thistle extract (100 mg/kg).
