Figure 1.

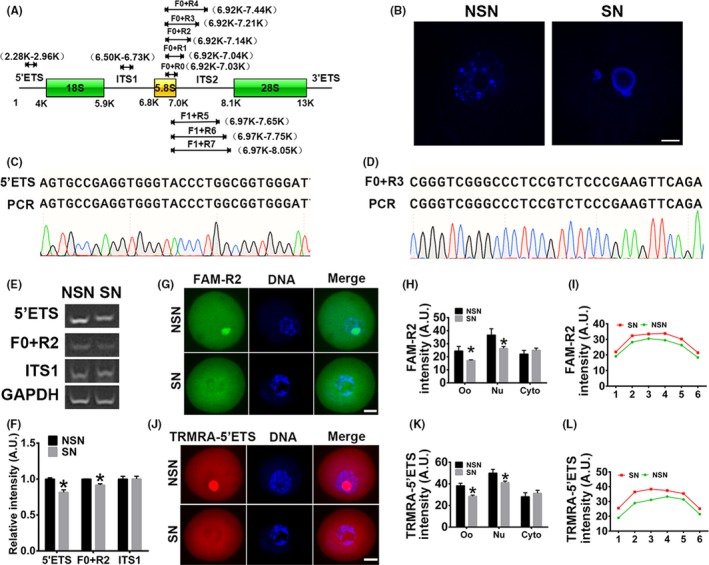
MPP6 is important for 5.8S rRNA processing. (A) Multiple primer pairs were designed to amplify different regions of pre‐rRNA (Detailed information about sequences and target regions is in Table S2). (B) FGOs (fully grown oocytes) from large antral follicles were stained with live‐cell dye hoechst 33 258 and then strictly subtyped into NSN (non‐surrounded nucleus) FGOs and SN (surrounded nucleus) FGOs for subsequent experiments. (C and D) Sanger sequencing showed that PCR product with 5'ETS (C) or F0 + R3 (D) primer in the SN FGOs was identical to the 5'ETS pre‐rRNA or 5.8S pre‐rRNA. (E) RT‐PCR showed that strong bands can be detected by any of primer pairs above (A) in both NSN and SN, but only products with 5'ETS primer and F0 + R2, not with ITS1, significantly decreased in SN FGOs. GAPDH was the loading control. (F) Quantification of E. (G) Fluorescence in situ hybridization (FISH) of pre‐5.8S rRNA with FAM‐R2 probe showed that in NSN oocytes, 5.8S pre‐rRNA was enriched within nucleus; while in SN oocytes, 5.8S pre‐rRNA significantly decreased within nucleus but tended to increased within the cytoplasm around nucleus. (H) Quantification of FAM‐R2 intensity of oocytes (Oo), nucleus (Nu) and cytoplasm (Cyto). (I) Representative intensity curve of cytoplasmic FAM‐R2 showed that FAM‐R2 intensity was higher around the nucleus in SN oocytes than in NSN oocytes. (J) FISH of pre‐rRNA with TRMRA‐5'ETS probe showed that in NSN oocytes, 5'ETS pre‐rRNA was enriched within nucleus; while in SN oocytes, 5'ETS pre‐rRNA significantly decreased within nucleus but tended to increased within the cytoplasm around nucleus. (K) Quantification of TRMRA‐5'ETS intensity of oocytes (Oo), nucleus (Nu) and cytoplasm (Cyto). (L) Representative intensity curve of cytoplasmic TRMRA‐5'ETS showed that TRMRA‐5'ETS intensity was higher around the nucleus in SN oocytes than in NSN oocytes. Scale bar, 20 µm. *P < .05
