
Figure 2.
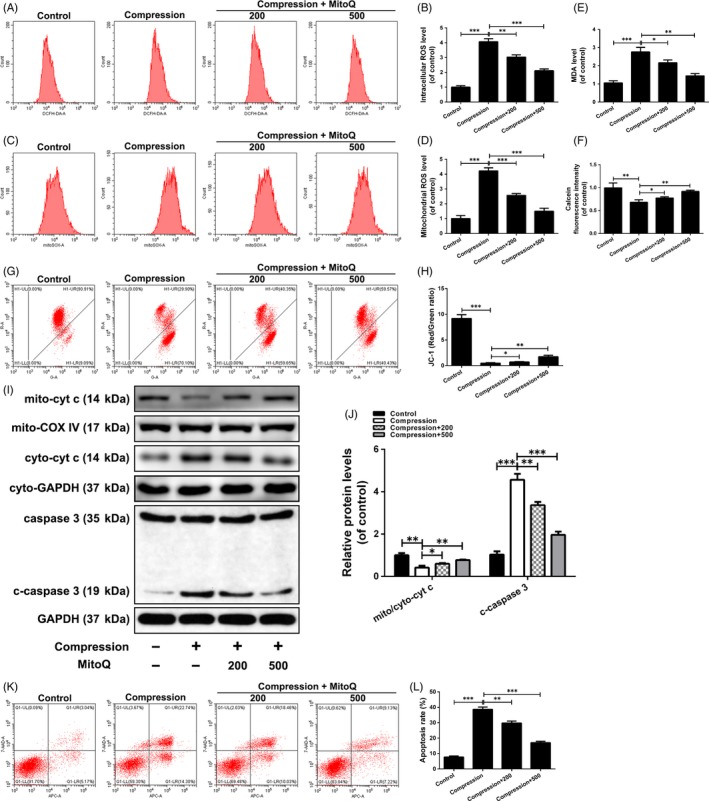
Effect of MitoQ on compression‐induced ROS accumulation, mitochondrial dysfunction and apoptosis in human NP cells. Human NP cells were pre‐treated with MitoQ (200 nmol/L, 500 nmol/L) for 2 h and then exposed to compression for 36 h. (A‐B) The intracellular ROS levels in the human NP cells were detected using the fluorescent probe DCFH‐DA and measured by flow cytometry. (C‐D) The mitochondrial ROS levels were detected using the mitochondrial ROS‐specific dye MitoSOX Red and measured by flow cytometry. (E) Intracellular MDA levels in the human NP cells. (F) Calcein fluorescence intensity in mitochondria represents opening level of mPTP, which is measured by flow cytometry. (G‐H) Mitochondrial membrane potential was detected by JC‐1 staining and measured by flow cytometry. (I‐J) The protein levels of mitochondrial cytochrome c (mito‐cyt c), cytoplasmic cytochrome c (cyto‐cyt c), caspase‐3 and cleaved caspase‐3 (c‐caspase 3) in the human NP cells were measured by Western blotting. (K‐L) Annexin V‐APC/7‐AAD staining results showing the rate of apoptosis in human NP cells. Data are represented as the mean ± SD. ***P < .001, **P < .01, *P < .05, n = 3