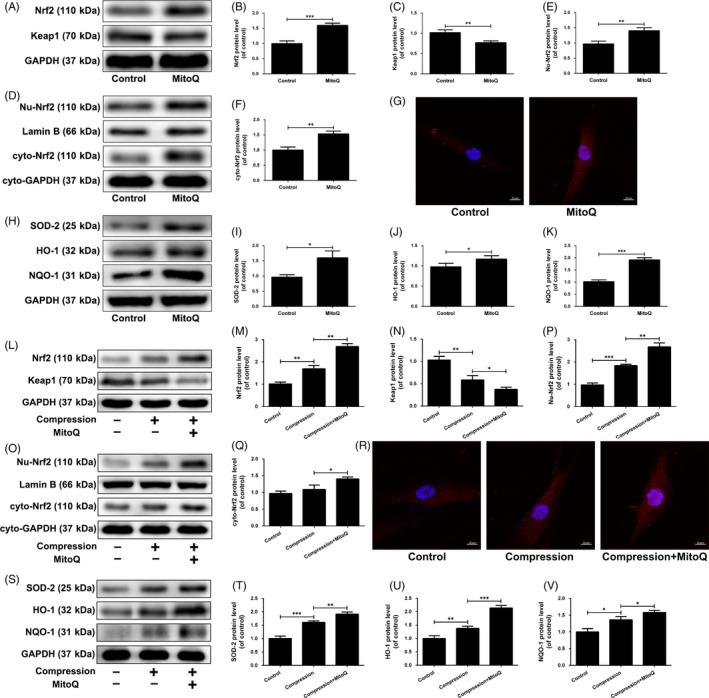
Figure 8.

Effect of MitoQ on the Nrf2 signalling in compression‐exposed human NP cells. (A‐J) Human NP cells were treated with or without MitoQ (500 nmol/L) for 12 h. (A‐C) The protein levels of Nrf2 and Keap1 in the human NP cells were measured by Western blotting. (D‐F) The protein expression of nucleus Nrf2 (Nu‐Nrf2) and cytoplasmic Nrf2 (Cyto‐Nrf2) was measured by Western blotting. (G) The nuclear translocation of Nrf2 was examined by immunofluorescence on confocal microscope. Scale bar: 10 μm. (H‐K) The protein levels of SOD‐2, HO‐1 and NQO‐1 in the human NP cells were measured by Western blotting. (L‐V) Human NP cells were pre‐treated with MitoQ (500 nmol/L) for 2 h and then exposed to compression for 36 h. (L‐Q) The protein levels of Nrf2, Keap1, Nu‐Nrf2 and cyto‐Nrf2 in the human NP cells were measured by Western blotting. (R) The nuclear translocation of Nrf2 was examined by immunofluorescence on confocal microscope. Scale bar: 10 μm. (S‐V) The protein levels of SOD‐2, HO‐1 and NQO‐1 in the human NP cells were measured by Western blotting. Data are represented as the mean ± SD. ***P < .001, **P < .01, *P < .05, n = 3
