
Figure 2.
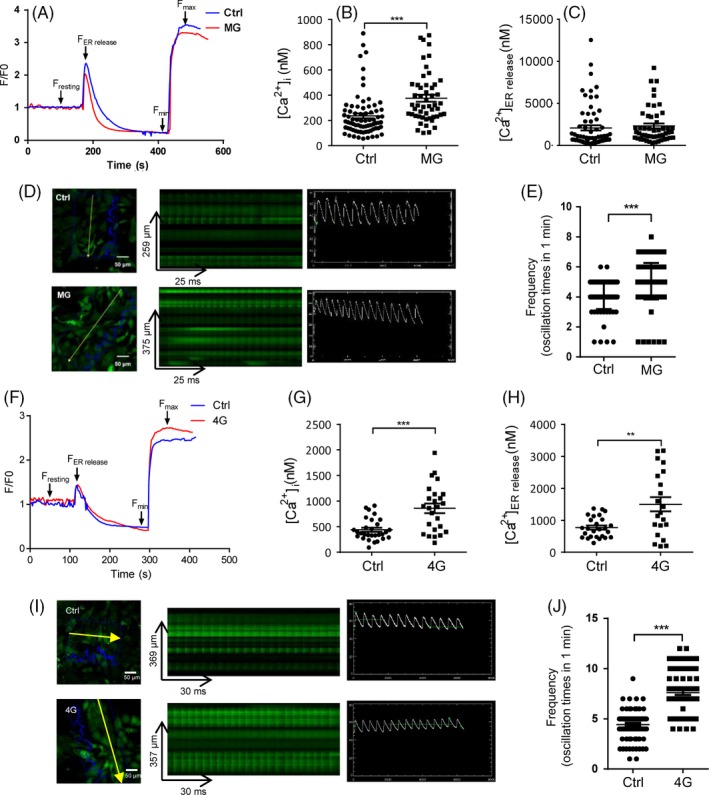
Altered spontaneous calcium signalling of HL‐1 cells following rotation‐simulated microgravity or hypergravity. A, Resting [Ca2+]i and [Ca2+] released from the endoplasmic reticulum (ER) of HL‐1 cells in the rotation‐simulated microgravity (MG) and control (Ctrl) groups, shown by imaging cellular Ca2+ signals with Fluo‐4 AM. B, Basal cytosolic Ca2+ levels ([Ca2+]i) in HL‐1 cells in the presence or absence of MG (n = 74 [Ctrl] and n = 51 [MG]). Cells were pooled from three independent experiments. C, Ca2+ releases from the ER ([Ca2+]ER release) in HL‐1 cells in the control and MG groups (n = 66 [Ctrl] and n = 50 [MG]). Cells were pooled from three independent experiments. D, Ca2+ transients in HL‐1 cells in the presence or absence of MG, detected by line scanning with a confocal microscope. Scale bar: 50 μm. E, Chart shows the frequency of spontaneous calcium oscillations, which were detected by frame scanning with a confocal microscope (n = 106 [Ctrl] and n = 124 [MG]). F, Measurement of [Ca2+]i and [Ca2+]ER release in the 4G hypergravity and control groups. G, [Ca2+]i in HL‐1 cells in the presence or absence of 4G hypergravity (n = 29 [Ctrl] and n = 25 [4G]). Cells were pooled from three independent experiments. H, [Ca2+]ER release in HL‐1 cells from the control and 4G hypergravity groups (n = 26 [Ctrl] and n = 22 [MG]). Cells were pooled from three independent experiments. I, Ca2+ transients in HL‐1 cells in the presence or absence of 4G hypergravity, detected by line scanning with a confocal microscope. Scale bar: 50 μm. J, Chart shows the frequency of spontaneous calcium oscillations, detected by frame scanning with a confocal microscope (n = 77 [Ctrl] and n = 76 [4G]). Representative results of three independent experiments are shown. Data are shown as mean ± standard error of the mean (SEM); unpaired Student's t test, **P < .01 and ***P < .001