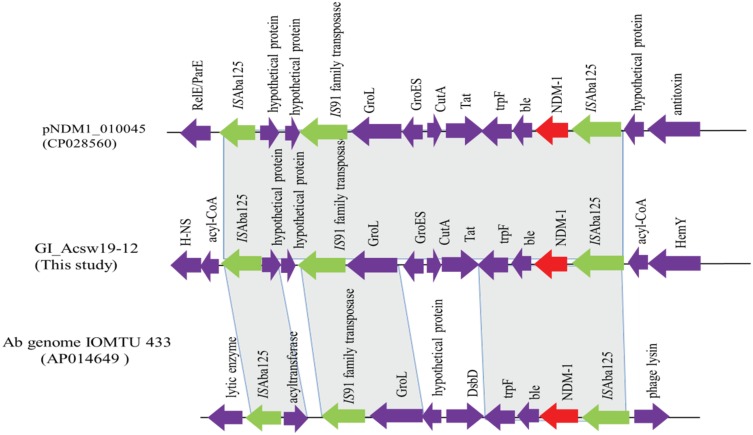
Figure 5.
Schematic map of the genetic context of the GI_Acsw19-2. The resistance genes are indicated by red arrows, the mobile genes are indicated by the green arrows and other function genes are indicated by the purple arrows. Gray areas between open reading frames (ORFs) denote nucleotide identities with the similarity context.

