
Figure 11.
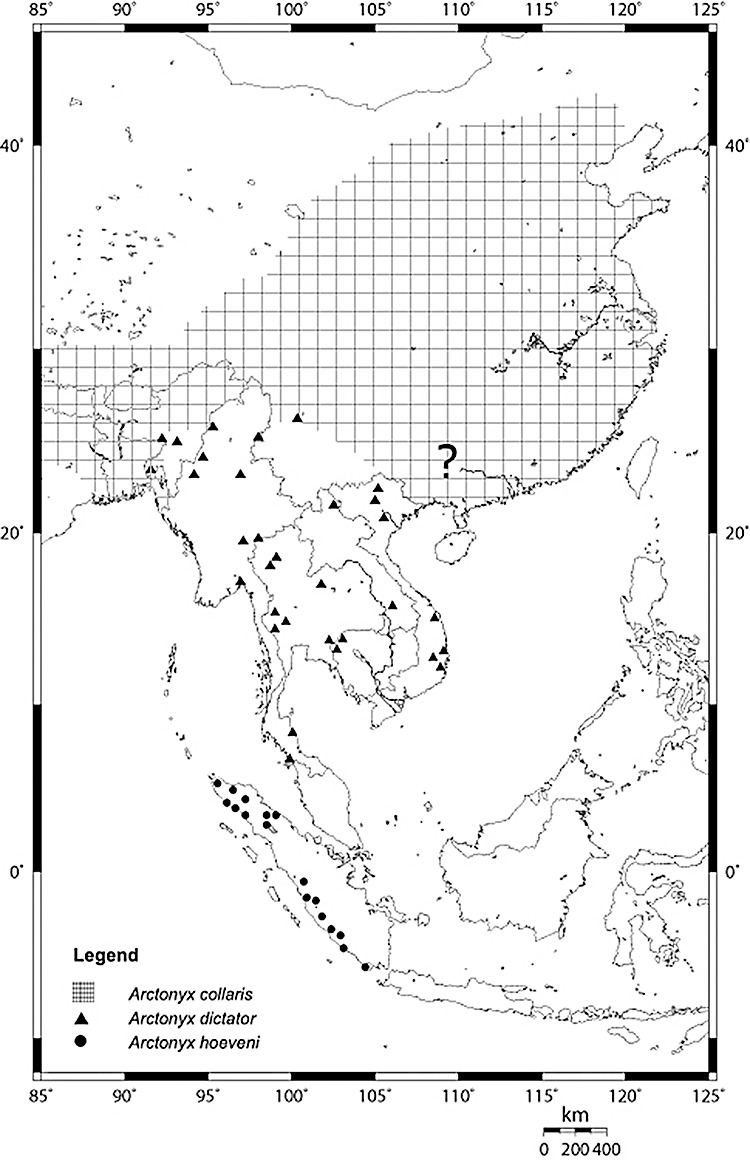
Map of the approximate distribution of Arctonyx spp. Verified point localities are figured for A. collaris (triangles) and A. hoevenii (circles). The approximate range of A. albogularis is shown by cross-hatching, mainly as documented by Pocock (1941), Zhang (1997) and the present study. We have not seen specimens of Arctonyx from far south-eastern China, and only questionably refer these populations to A. albogularis (cf. Zhang, 1997).