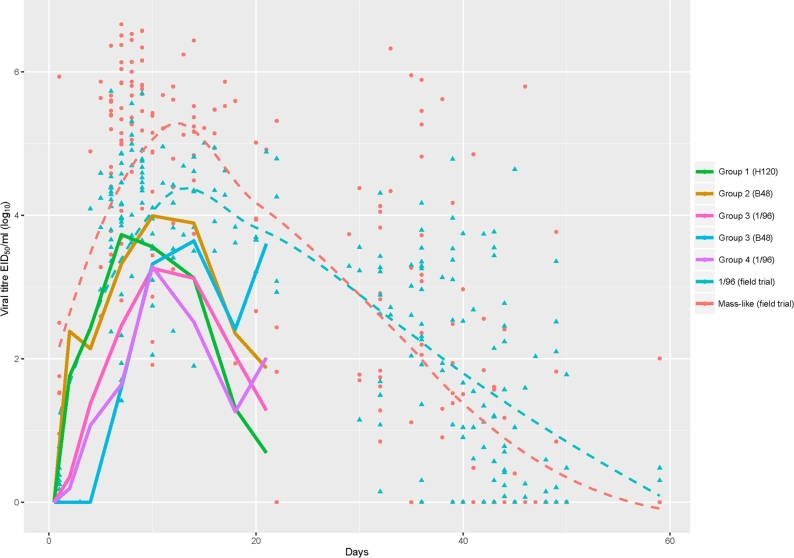
Figure 1.
Vaccine titer trends relative to animal age in experimental and field conditions: titers from the experimental trial are represented by continuous lines color-coded for each group (1 to 4); titers from the field trial are marked by red dots for Mass-like strains and by blue triangles for 1/96 strain, and the overall trend is depicted by red and blue lines, respectively.

