
Fig. 1.
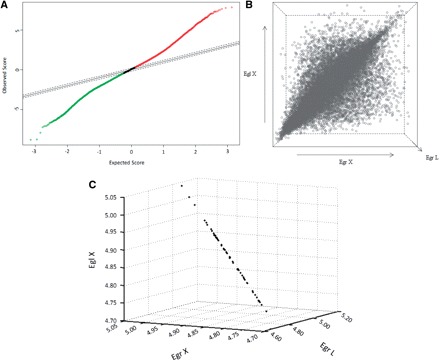
Expression of 21,432 Eucalyptus genes in E. grandis leaves and xylem and in E. globulus xylem evaluated by microarray hybridization analysis. (A) Scatter plot of the observed relative difference d(i) (observed score) vs. the expected relative difference dE(i) (expected score) built with the Significance Analysis of Microarray (SAM) method. The solid black line indicates the line for d(i) = dE(i), where the observed relative difference is identical to the expected relative difference with a delta set to 0.2. Solid and dotted red and green lines represent genes whose observed relative differences were lower or higher than the expected relative differences, i.e. whose expression varied among tissues tested. (B) Three-dimensional graph generated with the Standard Deviation Microarray Analysis (SDMA) method showing genes (open circles) expressed in positions equivalent to their overall average expression among the three conditions analyzed in the microarrays, i.e. leaves (EgrL, z-axis) and xylem (EgrX, x-axis) of E. grandis and xylem of E. globulus (EglX, y-axis). The higher concentration of circles around the main diagonal line proved that most genes exhibited very similar expression values in the analyzed tissues. The most differentially expressed genes appeared proportionally far from the main diagonal line. (C) SDMA 3D graph representing the 50 most invariable Eucalyptus genes according to microarray data. Points representing selected genes tend to form a straight line since their means of expression are similar to the global average, with a standard deviation tending to zero.