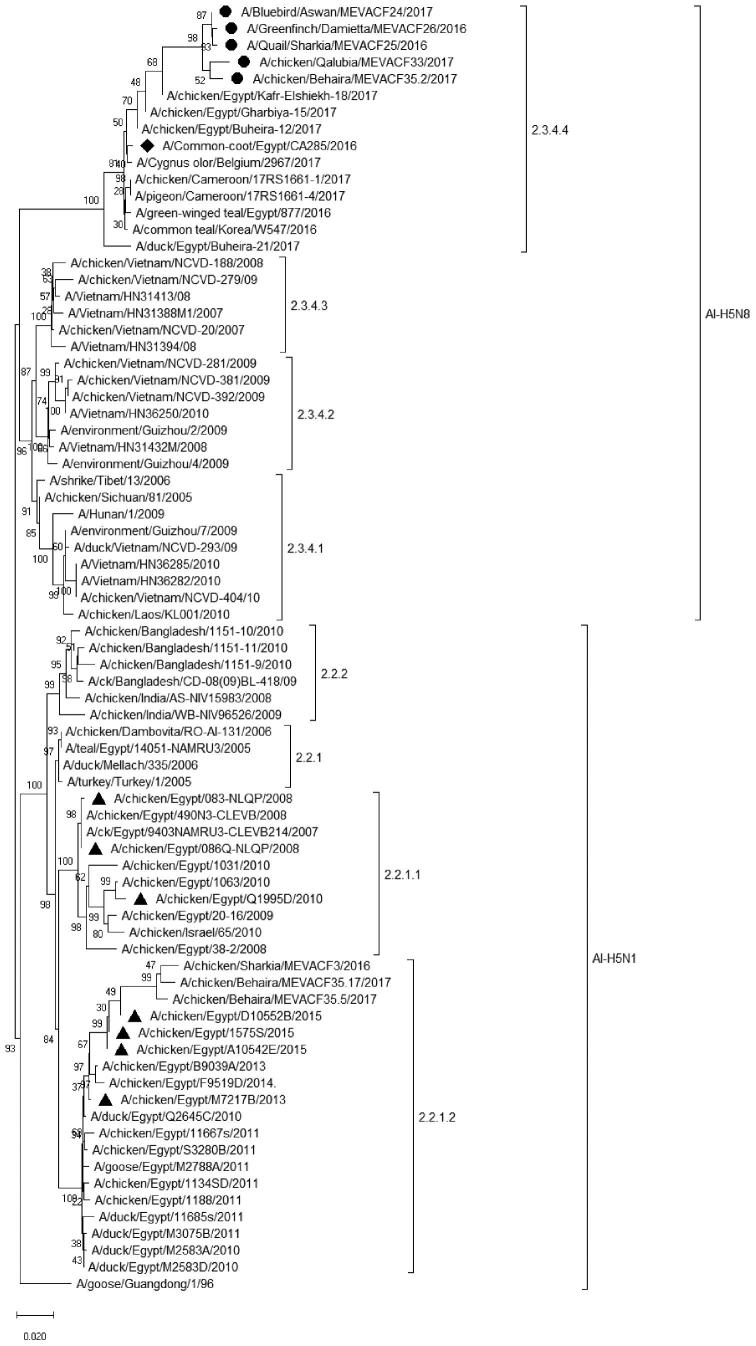
Figure 1.
Phylogenetic analysis of isolated H5N1 and H5N8. The tree was generated using neighbor-joining method, the Tamura-Nei model, and 1000 bootstrap replicates implemented in MEGA7.0. H5N8 (circle) were clustered with 2.3.4.4 viruses however, new H5N1 isolates (square) clustered with 2.2.1.2 clades. The viruses used for antigenic relatedness studies are indicated (triangle). The first isolated H5N8 virus is indicated (Diamond).

