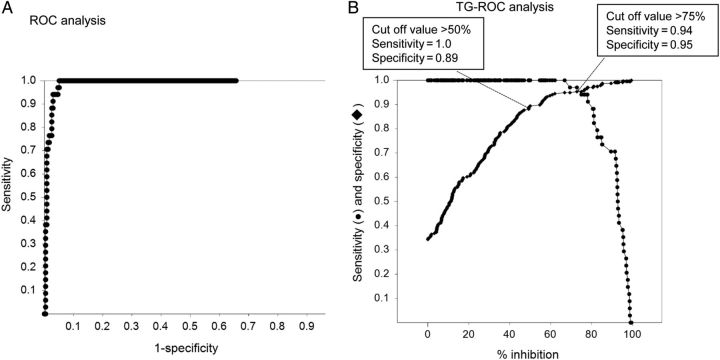
Figure 1.
The results of the ROC and two-graph (TG)-ROC analyses of the vesicular stomatitis virus pseudotype virus-bearing glycoproteins of Rift Valley fever virus, (RVFVpv)-based neutralization assay. In (A) the ROC analysis graph, the specificity values are deducted from 1.0 in the x-axis, and the sensitivity vs 1-specificity data are plotted as dots. In (B) the TG-ROC analysis graph, sensitivity data are plotted as dots and specificity data are plotted as diamonds.

