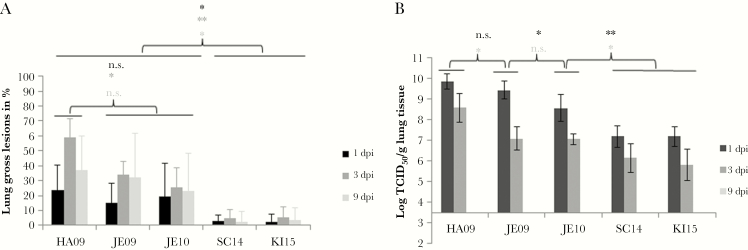
Figure 3.
Lung lesions (A) and viral lung load (B). Gross lung lesions (%, arithmetic mean with standard deviation) and the viral lung load (log TCID50, geometric mean with standard deviation) were determined after aerosol infection of approximately 11- to 16-week-old pigs by A(H1N1)pdm09 viruses isolated from 2009–2015. Statistical probability (Mann–Whitney U test): *P ≤ .05, **P ≤ .01, ***P ≤ .001. There were no significant differences between viruses SC14 and KI15; therefore, all statistical calculations were done with viruses HA09, JE09, and JE10 in comparison to KI15; 3.5 = detection limit due to predilutions of the samples. Significant differences were also found within the group of virulent viruses; lung lesions: HA09 > JE09/JE10 (P ≤ .021 at day 3); viral load: HA09 > JE09 (P = .001 at day 3) > JE10 (P = .006 at day 1). Number of pigs: HA09, 17; JE09, 15; JE10, 15; SC14, 13; KI15, 19. Abbreviations: dpi, days postinfection; n.s., not significant; TCID50, tissue culture infectious dose 50.

