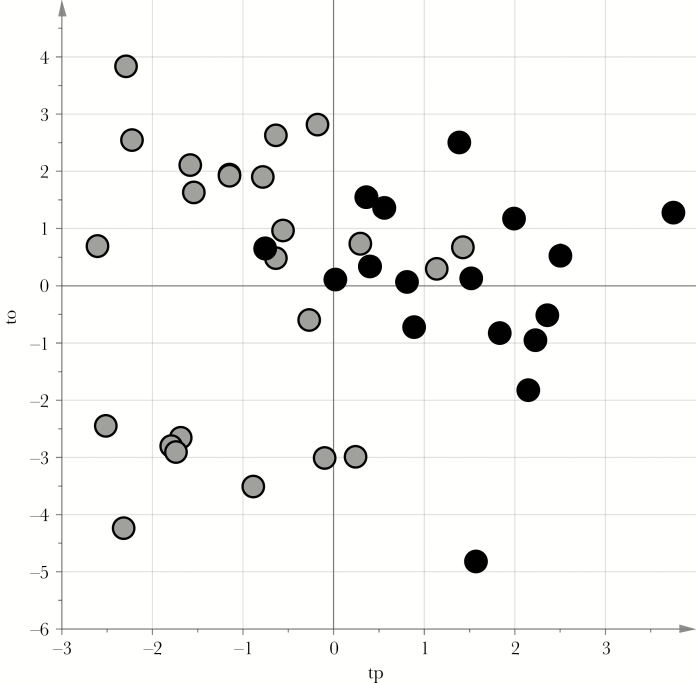
Figure 2.
Score scatterplot of the projection to latent structures discriminant analysis (PLS-DA) model for the no wheezing and recurrent wheezing groups. tp and to are the predictive and nonpredictive latent variables, respectively, obtained by posttransformation of the PLS-DA model. Gray circles represent urine samples from the no wheezing group, and black circles represent those from the recurrent wheezing group. The samples from the no wheezing group lie in the region with negative tp values, while those from the recurrent wheezing group show positive tp values.

