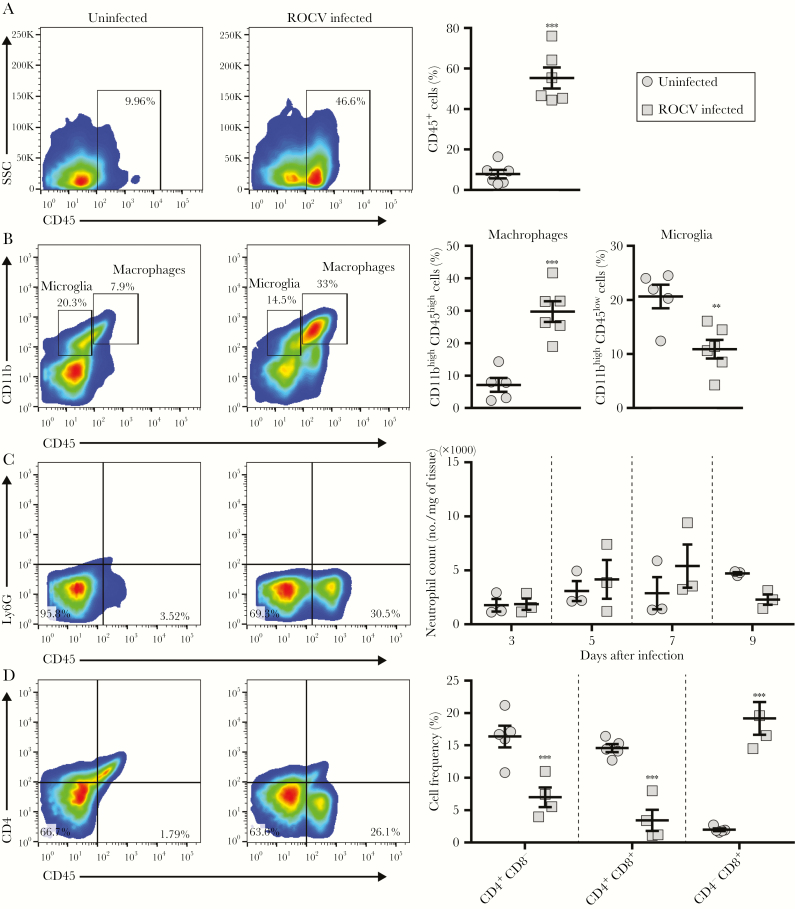
Figure 3.
Characterization of the immune cell profile in the brain after Rocio virus (ROCV) infection. Six-week-old female C57BL/6 mice (n = 3–6) were inoculated intraperitoneally with 2.8 × 10⁶ plaque-forming units (PFU) of ROCV or medium. Brains were collected 7 days after infection, and the total leukocyte population was purified. Flow cytometry plots indicate gating strategies and percentages of total leukocytes (CD45+); A), macrophages (CD11bhighCD45high) and microglia (CD11bhighCD45low); B), neutrophils (Ly6G+CD45+) cells in left 2 panels and myeloperoxidase levels in the right panel; C), and T cells (CD4+/CD8+); D). **P < .01 and ***P < .001, by the Mann-Whitney test, for comparison of infected and uninfected mice.

