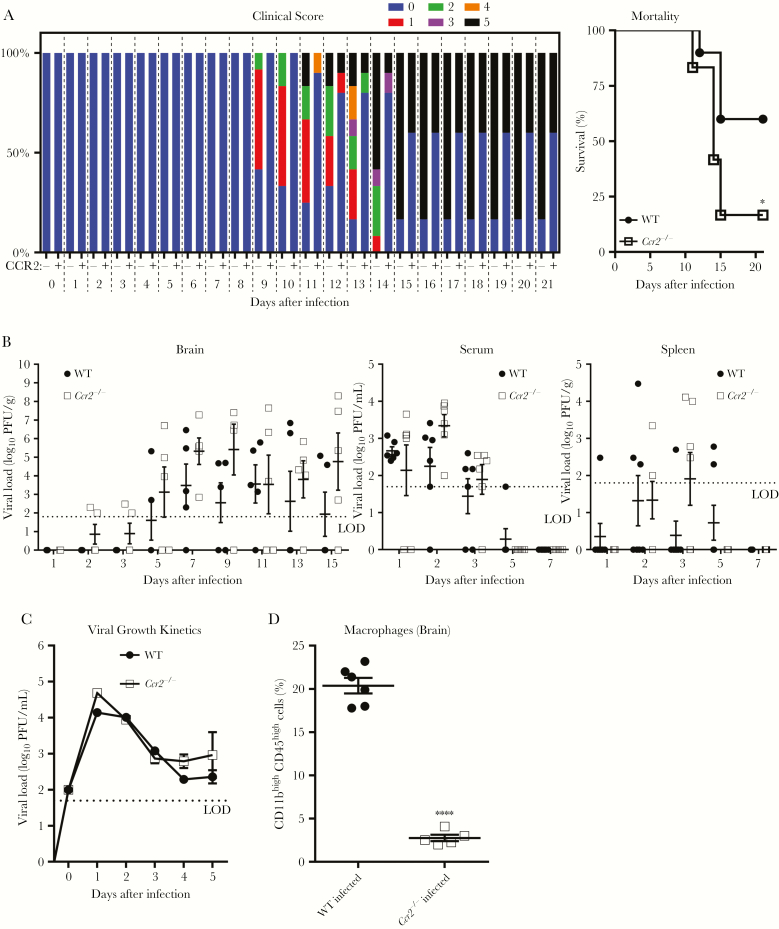
Figure 5.
Effect of CCR2 on controlling disease severity and macrophage infiltration into the brain after Rocio virus (ROCV) infection. Wild-type (WT) and CCR2 knockout (ie, Ccr2−/−) C57BL/6 female mice (age, 6 weeks) were inoculated intraperitoneally with 2.8 × 10² plaque-forming units (PFU) of ROCV (12 mice/group). A, Percentage of the total clinical score (left) and survival rate (right) were determined up to 21 days after infection. B, Viral load in the brain (left), serum (middle), and spleen (right) were determined at different time points. No differences in viral load in the brain, serum, and spleen at different time points were statistically significant, by the Mann-Whitney test. C, Viral growth kinetics in bone marrow–derived macrophages from WT or Ccr2−/− mice. Macrophages were infected at multiplicity of infection of 1 with ROCV, and cell supernatants were harvested 0, 1, 2, 3, 4, and 5 days after infection. No differences in viral load at different time points were statistically significant, by 2-way analysis of variance with the Tukey multiple comparisons test. D, Percentage of infiltrated macrophages (CD11bhighCD45high) in the brains of ROCV-infected WT and Ccr2−/− mice (5–6 mice/group). Virus titers were determined by a plaque assay on BHK-21 cells and are presented as PFU per gram of tissue or PFU per milliliter (for serum specimens). In scatter plots, each data point represents an individual mouse, and data from 3–6 mice per group at each time point were analyzed. Dotted lines denote the assay limits of detection. *P < .05, by the log-rank (Mantel-Cox) test; ****P < .0001, by the Mann-Whitney test.

