
Fig. 1.
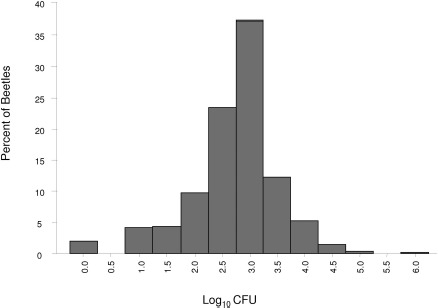
Frequency distribution of the bacterial load carried by individual beetles before disinfection procedures. A log10 transformation of the PRE-wash CFU data from 990 individual beetles was used to create the graph.
Official websites use .gov
A
.gov website belongs to an official
government organization in the United States.
Secure .gov websites use HTTPS
A lock (
) or https:// means you've safely
connected to the .gov website. Share sensitive
information only on official, secure websites.
Frequency distribution of the bacterial load carried by individual beetles before disinfection procedures. A log10 transformation of the PRE-wash CFU data from 990 individual beetles was used to create the graph.