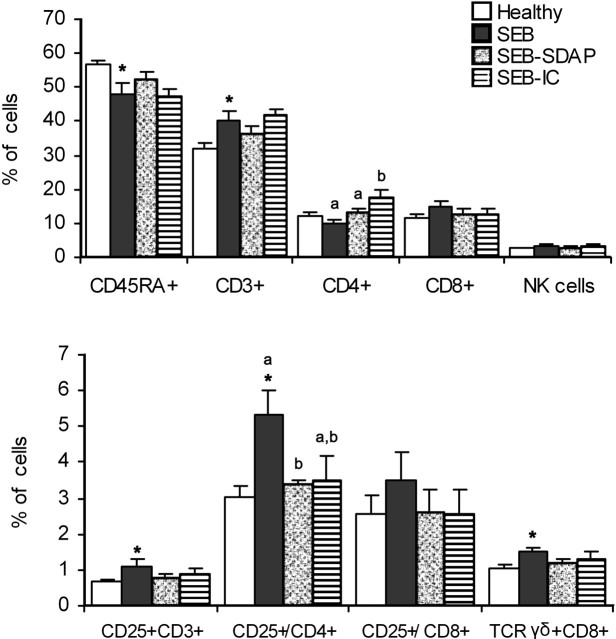
FIGURE 3.
Lymphocyte populations in Peyer's patches from Healthy rats and rats challenged with SEB and fed diets supplemented with SDAP or IC. CD45RA+ (as B lymphocytes), CD3+ (as T lymphocytes), CD4+ (as helper T lymphocytes), CD8+ (as suppressor/cytotoxic T lymphocytes), NK (as natural killer cells), CD25+CD3+ (as total activated T lymphocytes), CD25+/CD4+ (as the fraction of activated T helper lymphocytes), CD25+/CD8+ (as the fraction of activated suppressor/cytotoxic T lymphocytes), and γδ-T lymphocytes as percentages with respect to the total number of lymphocytes. Results are expressed as means ± SEM, n = 8–10. *Different from Healthy rats, P < 0.05. Means for rats challenged with SEB without a common letter differ, P < 0.05.

