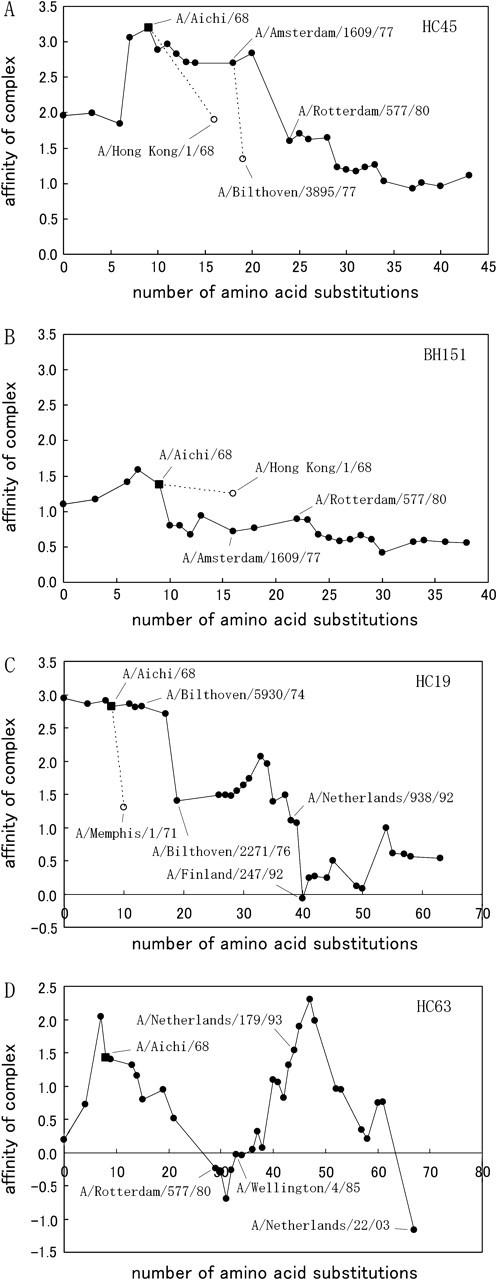
FIG. 5.—

The change of the affinity of the complex between Fab (A: HC45, B: BH151, C: HC19, D: HC63) and HA along the trunk-branches on the phylogenetic dendrogram of HA is shown by a solid line. The horizontal axis represents the number of amino acid substitutions of the contributing residues and background residues of HA reconstructed by the maximum-parsimony method. Several changes of the affinity on twig-branches are shown by dotted lines.
