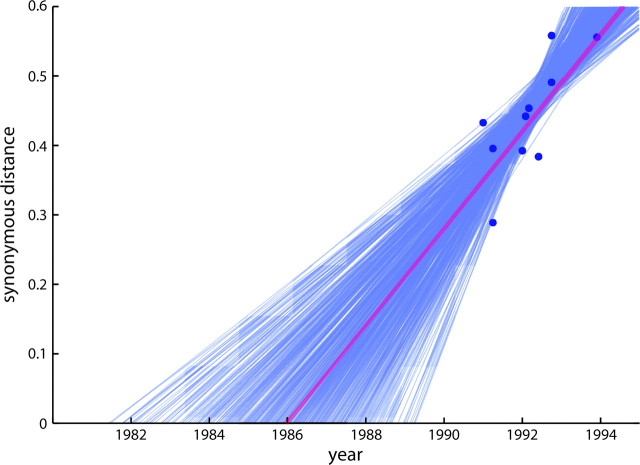
FIG. 4.—
Divergence time was calculated by the least squares method. Values on the vertical axis indicate the synonymous distance from the ancestral node to each strain of PRRSV-A. Values on the horizontal axis indicate the year of isolation. A blue solid circle indicates each PRRSV-A strain. The red line was calculated from the original sequence data. Each blue line was obtained by the bootstrap method. A detailed explanation is presented in the Materials and Methods.

