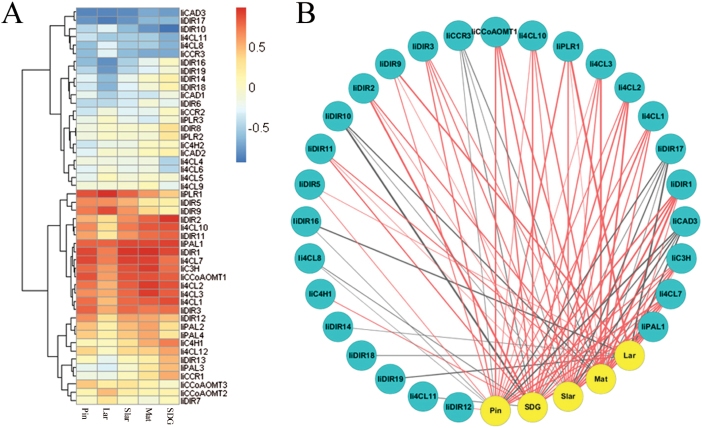
Fig. 3.
Correlation between lariciresinol biosynthetic gene expression and lignan accumulation. (A) Heat map showing gene–lignan correlation coefficients. The rows in the heat map are the genes clustered by their expression patterns, and the columns are lignan metabolites. (B) Gene–lignan correlation network with a cut-off |r|>0.6. Genes and lignans are drawn as blue and yellow circles, respectively. Red and grey lines indicate positive and negative correlations, respectively. The thickness of lines represents the level of correlation. Pin, pinoresinol; Lar, lariciresinol; Slar, secoisolariciresinol; Mat, mataireisnol; SDG, secoisolariciresinol diglucoside.

