Figure 3.
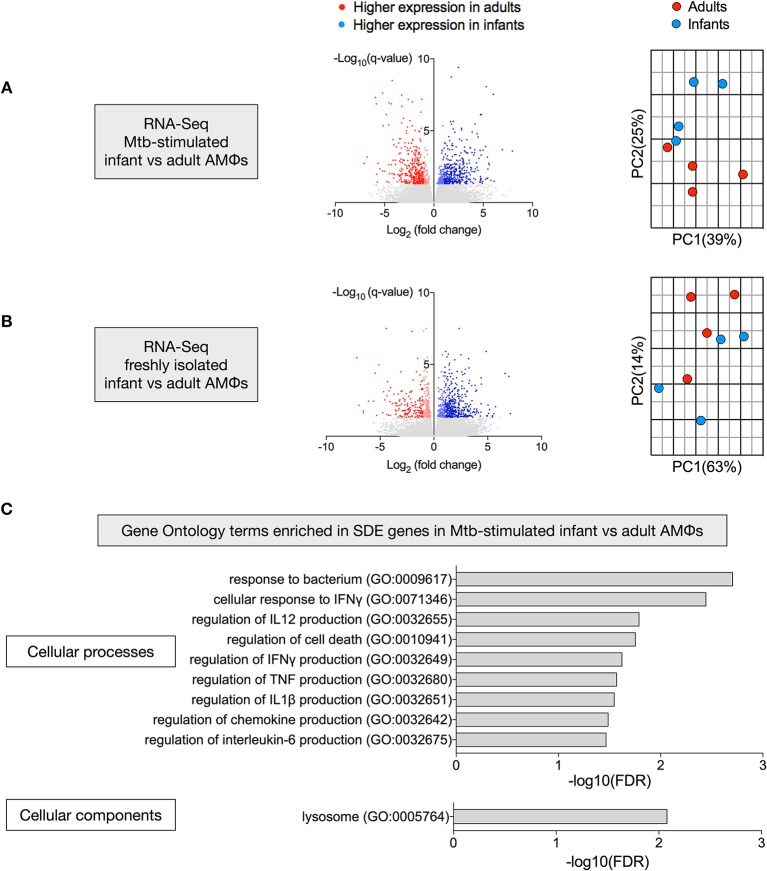
Transcriptional disparity between Mtb-stimulated infant vs. adult AMϕs. RNA-Seq of infant vs. adult AMϕs following (A) infection with Mtb H37Rv at MOI 5:1 for 24 h; and (B) adherence of freshly isolated cells for 1 h. For volcano plots (left), blue dots represent genes that were significantly (FDR < 0.05) differentially expressed (SDE) more highly in infants [log2(fold change>1 infant expression/adult expression)], and red dots represent genes that were SDE more highly in adults [log2(fold change < -1 infant expression/adult expression)]. For Principal Component Analyses (right), blue dots represent each individual infant participant and red dots represent each individual adult participant. (C) Gene ontology (GO) enrichment analysis of SDE genes in Mtb-stimulated infant vs. adult AMϕs showing significantly enriched GO terms for cellular processes (top) and cellular components (bottom).

