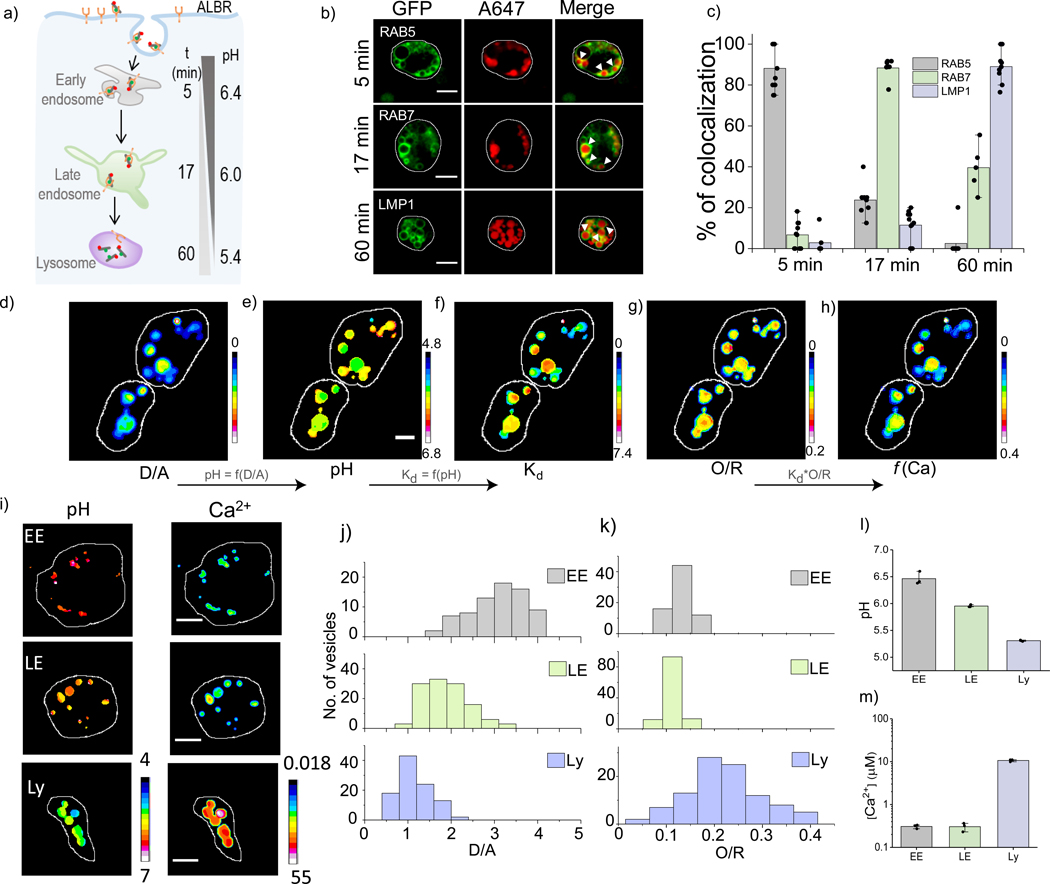
Figure-3: pH and [Ca2+] maps accompanying endosomal maturation.
(a) CalipHluor marks the indicated organelles in coelomocytes time dependently, by scavenger receptor mediated endocytosis. (b) Colocalization of CalipHluor and GFP-tagged markers of endocytic organelles at indicated time points post-injection in nematodes. (c) Quantification of colocalization in (b) (n = 10 cells, ≥ 50 endosomes) Pseudo color images of CalipHluorLy labelled lysosomes where the D/A map (d) is converted to the corresponding pH map (e), the pH map is converted into a Kd map (f) where the value of Kd is encoded pixelwise according to the pH at that pixel; the Kd map (f) is multiplied by the O/R map (g) to yield the Ca2+ map (h). (i) Representative pseudocolor pH and Ca2+ maps of early endosomes (EE), late endosomes (LE) and lysosomes (Ly) labelled with CalipHluor and CalipHluorLy. (j-l) Distributions of D/A and O/R ratios of EE, LE and Ly from n = 15 cells, 50 endosomes. (h) Mean endosomal pH of EE, LE and Ly. (i) Mean endosomal [Ca2+] in EE, LE and Ly data represent the mean ± s.e.m. Experiments were repeated thrice independently with similar results.

