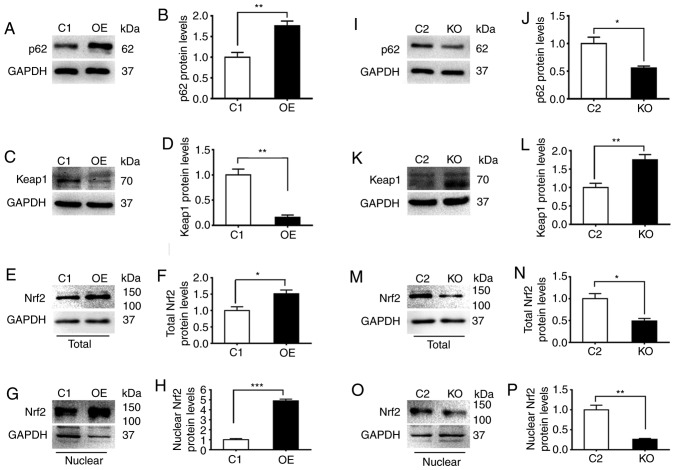
Figure 2.
p62 suppresses the expression of Keap1 and enhances the activity of Nrf2. C1, DU145 cells carrying the control plasmid vector; OE, DU145 cells overexpressing p62; KO, OE cells with p62 knocked out by CRISPER technology; and C2, OE cells carrying negative control for CRISPR knockout. (A-P) Representative (A, C, E, G, I, K, M and O) immunoblots and (B, D, F, H, J, L, N and P) quantification showing levels of (A, B, I and J) p62, (C, D, K and L) Keap1, and (E, F, M and N) total and (G, H, O and P) nuclear Nrf2 in (A-H) C1 and OE cells and (I-P) C2 and KO cells. (Q-T) Representative images revealing the (Q and R) immunostaining intensities and (S and T) quantification of (Q and S) Keap1 and (R and T) Nrf2 in C1, OE, C2 and KO cells. The nuclei were stained with DAPI (blue). All images were captured under an identical setting. The results represent three independent experiments. *P≤0.05, **P≤0.01, and ***P≤0.001. Keap1, Kelch-like ECH-associated protein 1; Nrf2, nuclear factor erytheroid-derived 2-like 2.


