
Figure 2.
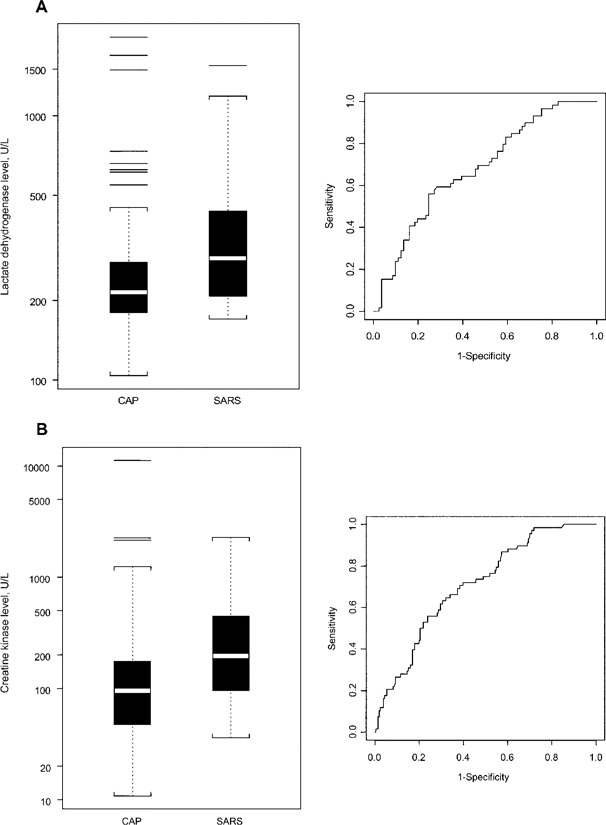
Box plots and receiver operator characteristic curves for lactate dehydrogenase (A) and creatine kinase level (B), comparing data for patients with community-acquired pneumonia (CAP) with data for patients with severe acute respiratory syndrome (SARS). White bar, median value; shaded area, 25th to 75th percentile; black lines, outliers; brackets, the most extreme data points that are within 1.5 times the interquartile range, from the 25th to the 75th percentile.