
Figure 1.
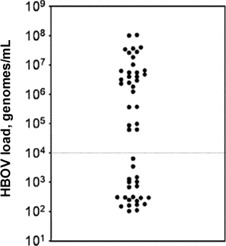
Distribution of human bocavirus (HBoV) genome loads among all 49 nasopharyngeal aspirate samples that tested positive for HBoV. Each sample is represented by a single dot. The dotted line indicates the cutoff between the high and low HBoV load groups discussed in the text.