
Figure 2.
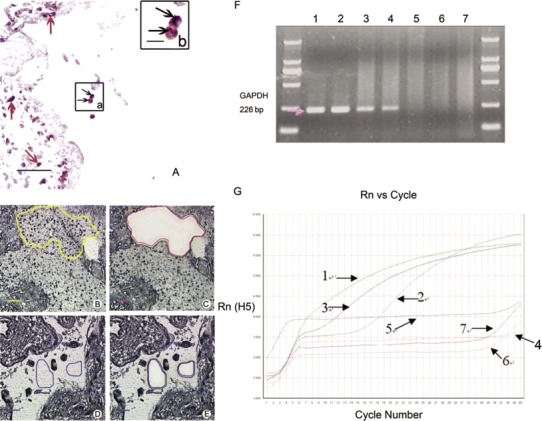
H5N1 nucleotide sequences detected in neutrophils by in situ hybridization, microdissection, and enhanced real-time PCR (ERT-PCR). A, Positive in situ hybridization signals of H5N1 (purple-blue; black arrows) detected in CD15-positive cells (red-brown; black arrows) in placental villi (inset a). Macrophages and trophoblastic cells in placental villi were also positive (purple-blue; red arrows; bar, 50 µm). Inset b shows enlargement of inset a, which shows that the same neutrophils contain H5N1 nucleotide sequences (bar, 10 µm). B and C, Three thousand leukocytes, dissected from the infected placenta as the test group. B, Before laser microdissection (bar, 50µm). C, After laser microdissection (bar, 50µm). D and E, Blood preparations with no leukocytes, dissected from the infected placenta as the blank group. D, Before laser microdissection (bar, 50 µm). E, After laser microdissection (bar, 50 µm). Three thousand leukocytes from uninfected placenta were also dissected as a negative control (data not shown). F, Measurement of glyceraldehyde 3-phosphate dehydrogenase (GAPDH) by reamplification of PCR. Lane 1, GAPDH PCR of the positive control group. PCR reamplification of GAPDH of the positive control group (lane 2), on the test group (lane 3), of the negative control group (lane 4), and of the blank group (lane 5). Lane 6, GAPDH PCR of water. Lane 7, PCR reamplification of GAPDH of water. G, Measurements of H5 ERT-PCR for different samples. 1, ERT-PCR measurement of the H5-positive control group. 2, Real-time PCR measurement of the H5-positive control group. ERT-PCR measurement of the test group (3), of the blank group (4), and of the negative control group (5). 6, Real-time PCR measurement of water. 7, ERT-PCR measurement of water. bp, Base pairs.