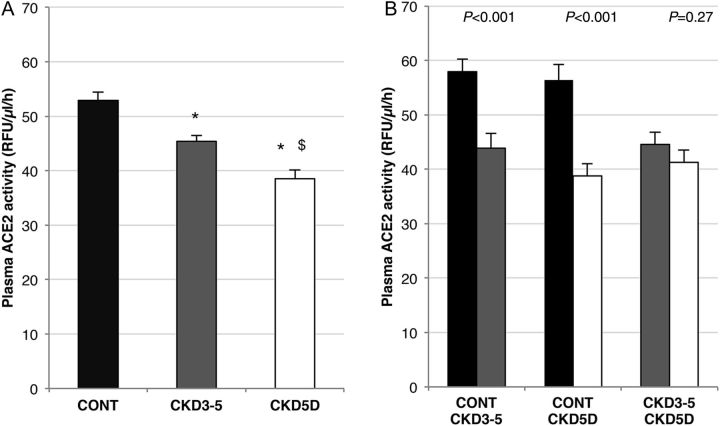
FIGURE 2:
Circulating ACE2 activity between studied groups. (A) ACE2 activity significantly decreased in CKD3-5 (grey bars) and CKD5D (white bars) patients as compared with CONT (black bars) (*P < 0.001). CKD3-5 showed an increase in plasma ACE2 activity as compared with CKD5D ($P < 0.001). When matching samples with an equal distribution of gender, diabetes, hypertension, dyslipidemia, smoking habits, weight and age (B), ACE2 activity significantly decreased in CKD3-5 and CKD5D as compared with CONT, but no differences were found between CKD3-5 and CKD5D (P = 0.27). CONT, control patients; CKD3-5, non-dialysis patients with chronic kidney disease stage 3–5; CKD5D, dialysis.

