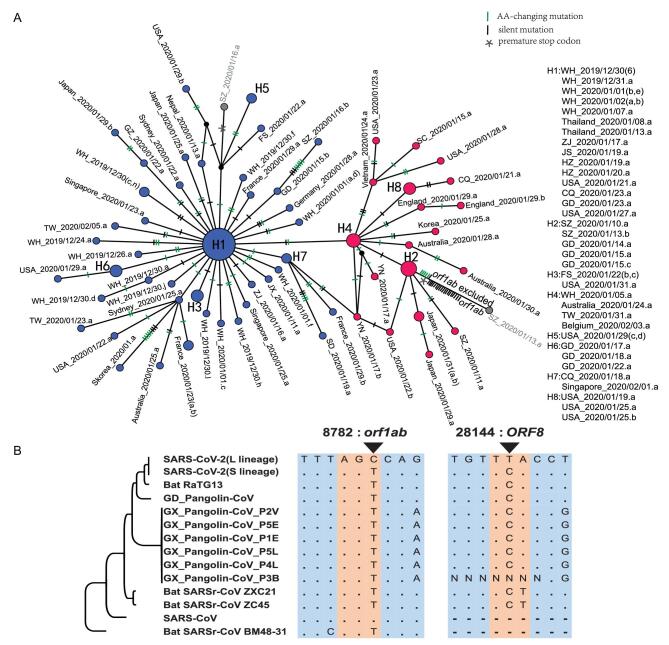
Figure 4.
Haplotype analysis of SARS-CoV-2 viruses. (A) The haplotype networks of SARS-CoV-2 viruses. Blue represents the L lineage, and red is the S lineage. Note that in this study, we marked each sample with a unique ID that starting with the geological location, followed by the date the virus was isolated (see Table S1 for details). Each ID did not contain information of the patient's race or ethnicity. ZJ, Zhejiang; YN, Yunnan; WH, Wuhan; USA, United States of America; TW, Taiwan; SZ, Shenzhen; SD, Shandong; SC, Sichuan; JX, Jiangxi; JS, Jiangsu; HZ, Hangzhou; GZ, Guangzhou; GD, Guangdong; FS, Foshan; CQ, Chongqing. (B) Evolution of the L and S lineages of SARS-CoV-2 viruses. ‘.’, The nucleotide sequence is identical; ‘-’, gap.

