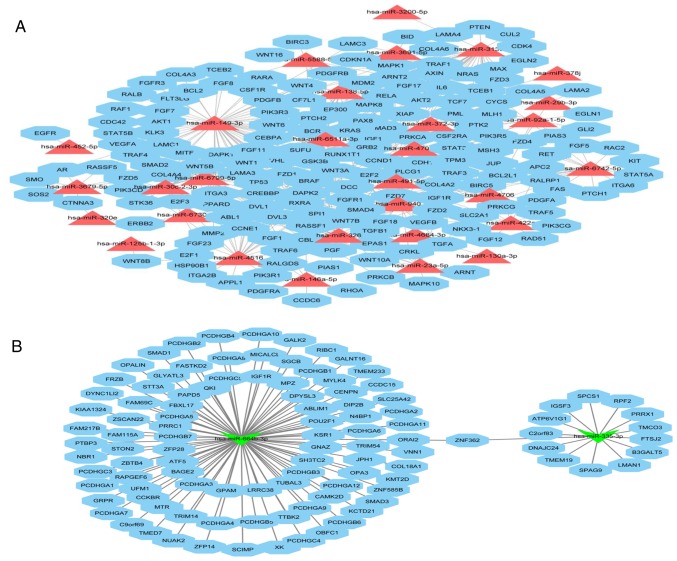
Figure 7.
Functional enrichment miRNA-mRNA interaction network analysis of DE miRNA targets. Integrated miRNA/mRNA analysis of potential target mRNAs associated with (A) upregulated or (B) downregulated miRNAs. The triangle refers to DE miRNAs, and the polygon represents the target mRNAs, respectively. Red triangles represent significantly upregulated miRNAs, while green triangles represent significantly downregulated miRNAs. DE, differentially expressed.

