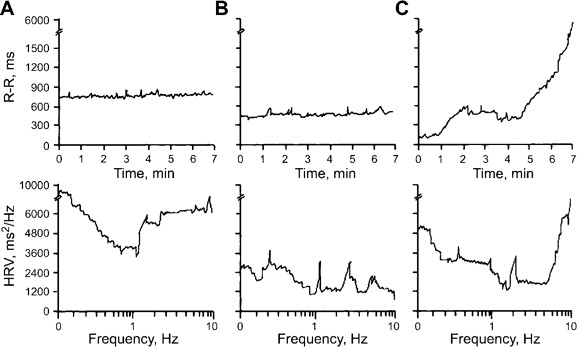
Figure 4.

Heart rate (HR; the reverse of the R-R interval) and HR variability (HRV) in a patient with acute respiratory distress syndrome at the onset of dyspnea (A), 1 h after onset (B), and 30 min before death (C). Note the dominant high frequency power spectrum at the onset of dyspnea and the decrease in HR before death, with a further increase in the high frequency domain.
