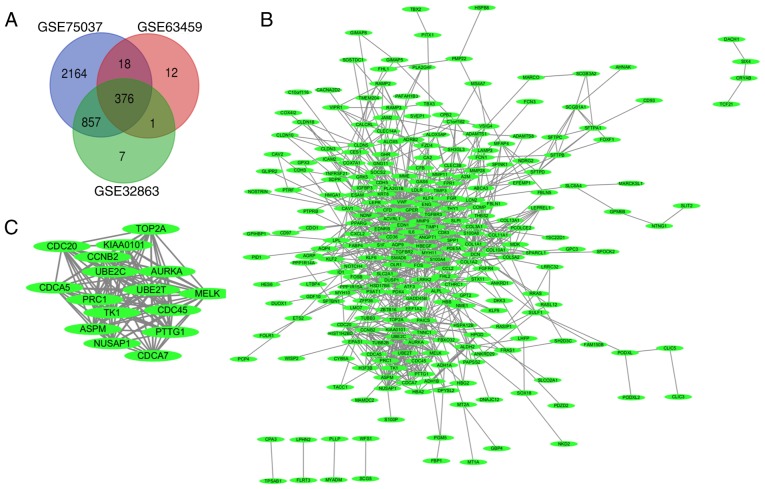
Figure 1.
Venn diagram, protein-protein interaction network and the most significant components of DEGs. (A) DEGs were selected with P-value <0.05 and a fold change >2 among the mRNA expression profiling sets GSE75037, GSE63459 and GSE32863. These three datasets manifested an overlap of 376 genes. (B) The protein-protein interaction network of DEGs was constructed using Cytoscape software. (C) The most significant components of the DEGs were obtained from protein-protein interaction network with 16 nodes. DEGs, differentially expressed genes.

