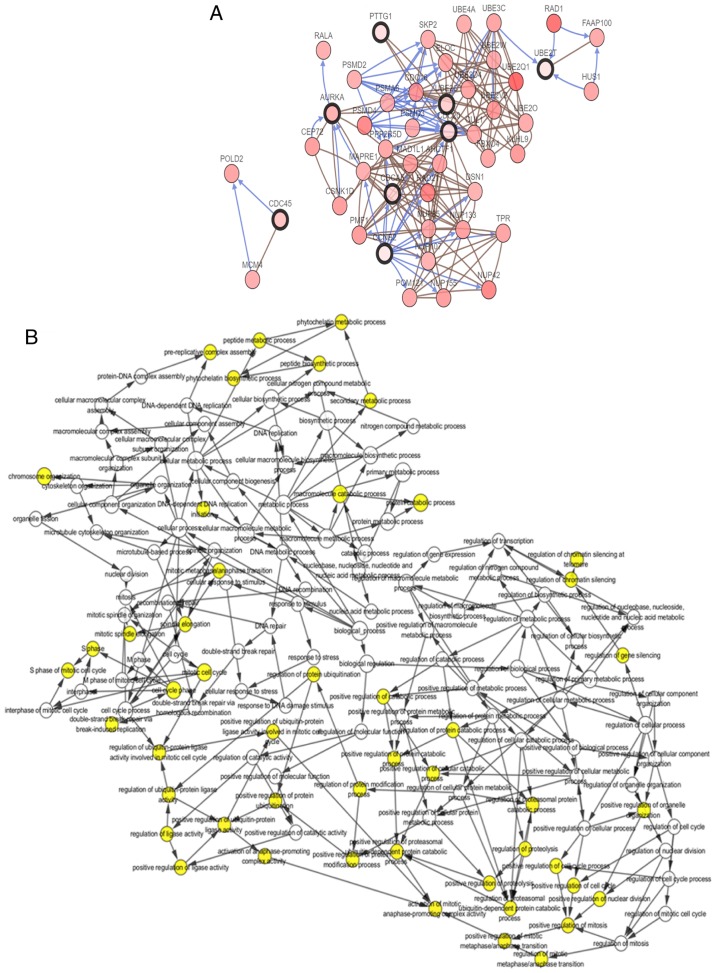
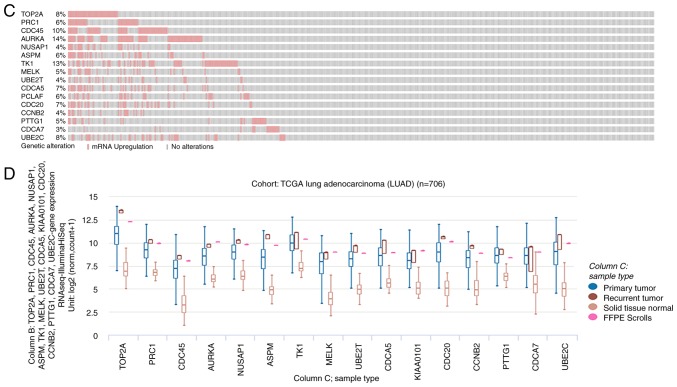
Figure 2.
Interaction network of the hub genes and the biological process analysis. (A) cBioPortal platform were used to analyze the hub genes and the co-expression genes. The hub genes are marked with a bold outline. Co-expression genes are marked with a thin outline. (B) The plugin of Cytoscape, BiNGO, was adopted to conduct the analysis of biological process. P-value of the ontologies are represented by different color shade. The yellow node indicates higher functional enrichment than white. The numbers of the genes involved in the ontologies are represented by the different size of the node. P<0.05 was considered statistically significant. Interaction network of the hub genes and the biological process analysis. (C) The hub gene alteration rates in lung adenocarcinoma were screened from cBioPortal platform; the red-colored bars represent the upregulation of the gene. (D) The UCSC (University of California Santa Cruz) cancer platform was used to construct the hub gene hierarchical clustering. The primary tumor, recurrent tumor and normal tissue are represented in different colors.


