
Figure 3.
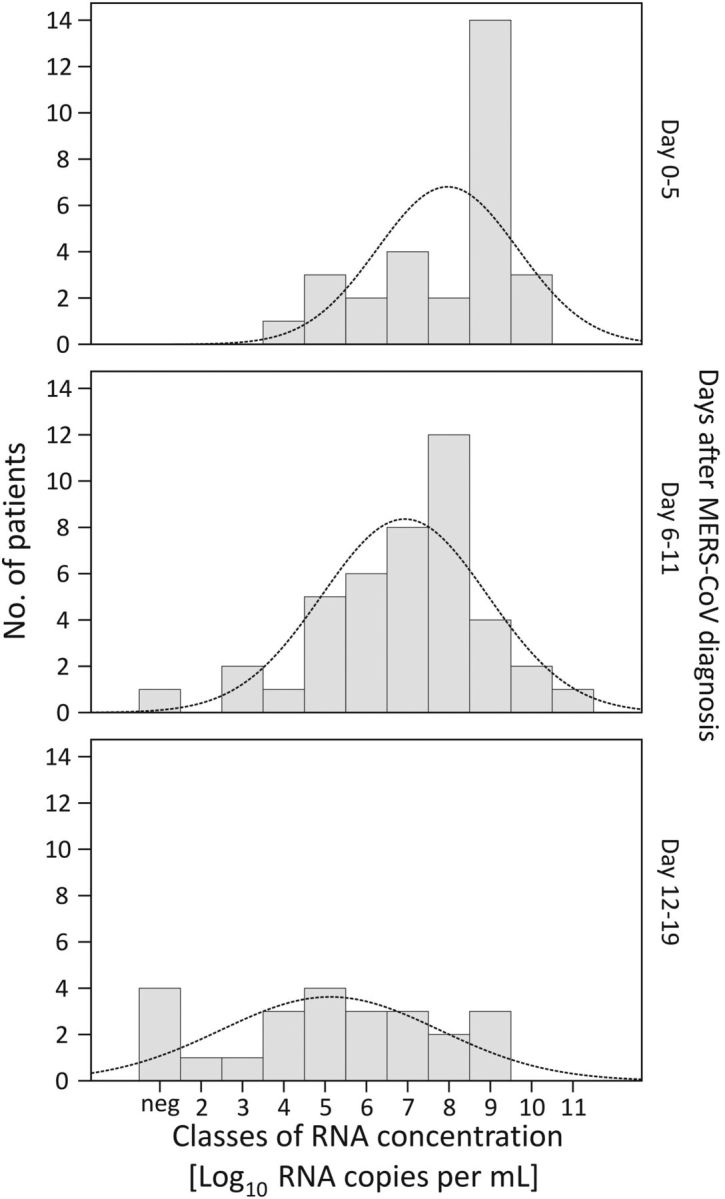
Distribution of RNA viral loads in lower respiratory tract Middle East respiratory syndrome coronavirus (MERS-CoV) samples in 3 time windows. Columns show viral loads for each patient averaged over the time windows indicated to the right of each panel. Curves represent ideal normal distributions based on sample means and variance.