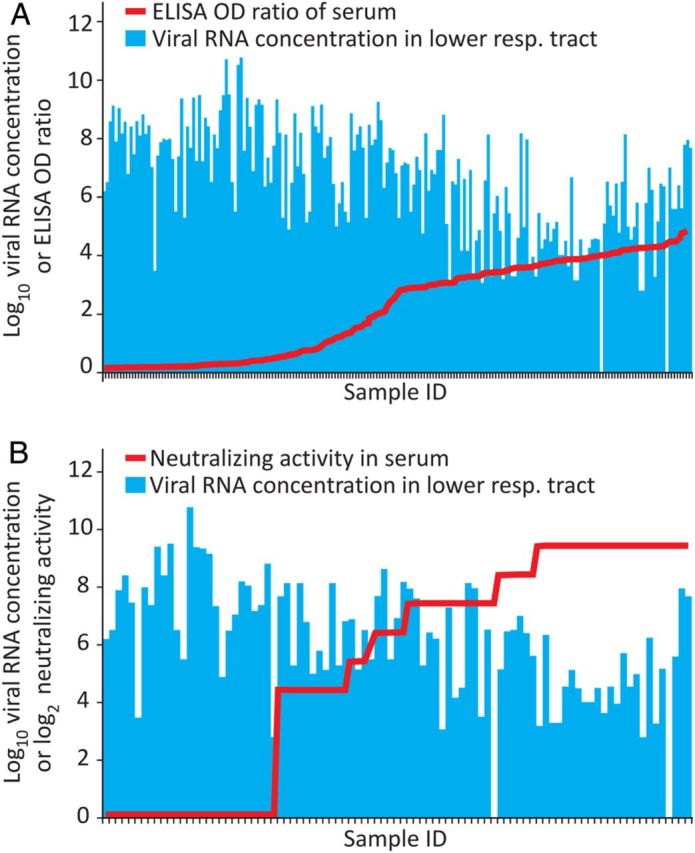
Figure 5.

Effect of serum antibodies on lower respiratory tract (LRT) viral loads. This analysis is based on paired serum and LRT samples taken from the same patient on the same day. Antibodies are shown as line graphs. Viral loads in the corresponding LRT samples are shown as columns. The panels show samples sorted according to increasing levels of enzyme-linked immunosorbent assay (ELISA) optical density (OD) ratios (A) or neutralizing antibody titers (B). Sample numbers for this analysis are summarized in Supplementary Figure 3.
