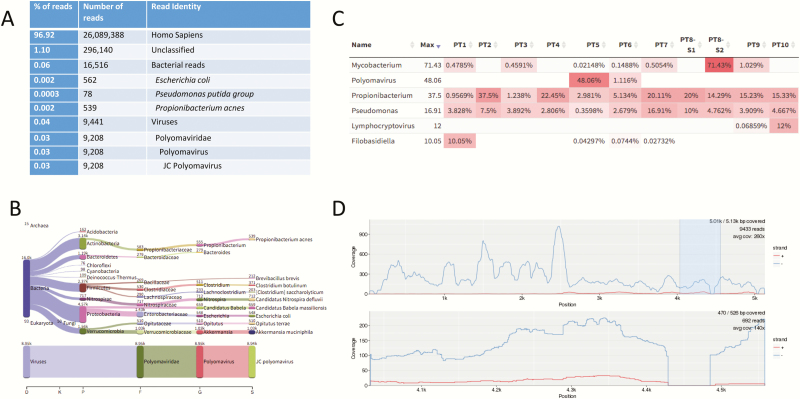
Figure 3.
Example of results output and bioinformatics analysis tools for metagenomic next-generation sequencing data. A, A simplified Kraken report showing the number and percentage of sequence reads and their alignment identification using Kraken for a cerebrospinal fluid (CSF) specimen from a patient diagnosed with JC virus encephalitis [17]. The overall Kraken report summarizing the data from the CSF specimen is >2000 line listings long (see Supplementary Data). Of note, Escherichia coli, Pseudomonasputida group, and Propionibacterium acnes (now Cutibacterium acnes) were considered reagent contaminants in this case as they were observed in the no-template control. B–D, Analysis modes of the Web-based Pavian program, a straightforward interface to analyze and compare complex metagenomics datasets. B, The number of sequence reads matching each taxa of interest are shown for the sample. Of note, almost all the virus reads align to JC polyomavirus. C, A heat map approach showing the percentage of microbially matched reads across multiple samples allowing for sample comparison. D, An interactive alignment tool showing the fold coverage of the reads over the whole JC virus genome [29].

