
Figure 1.
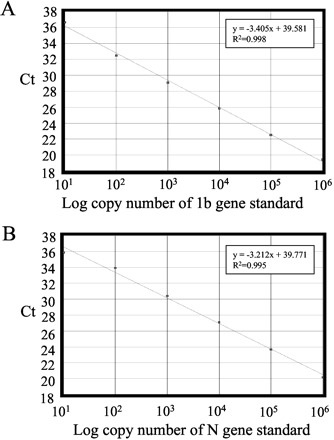
Real-time quantitative RT-PCR assays for SARS CoV.
(A), calibration curve for quantitative analysis of ORF 1b gene of SARS CoV. (B), calibration curve for quantitative analysis of N gene of SARS CoV. The Ct is the number of PCR cycles required for the fluorescence intensity of the reaction to reach a predefined threshold. The Ct is inversely proportional to the logarithm of the starting concentration of plasmid DNA. Equations for the regression lines and correlation coefficients are indicated.