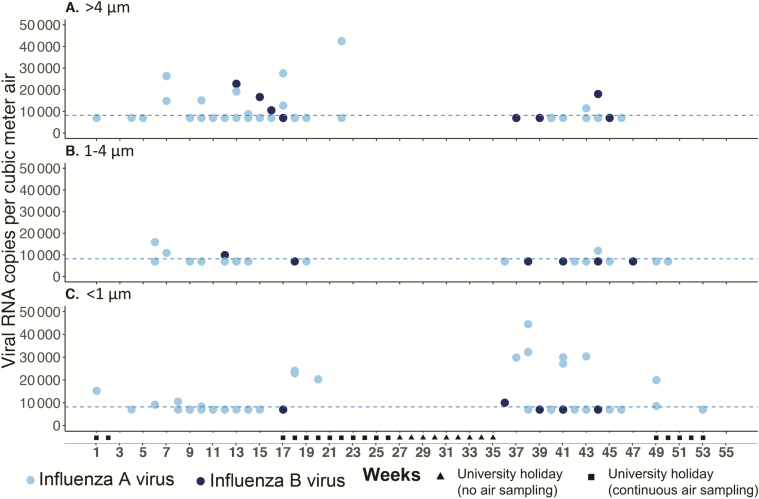
Figure 2.
Temporal changes in the detection of influenza airborne particles by size. Air sampling was conducted weekly except during the summer holiday in 2017 (weeks 19–35) using National Institute for Occupational Safety and Health bioaerosol samplers that collect airborne particles into 3 size fractions. Influenza A virus (IAV; light blue dots) and influenza B virus (IBV; dark blue dots) viral RNA (vRNA) was detected and quantified by quantitative real-time reverse-transcription polymerase chain reaction (rRT-qPCR). The dotted line indicated the linear range of quantification threshold at 8163 M gene copies/m3 air. Dots between zero and the quantification threshold indicate rRT-qPCR–positive samples that cannot be quantified. Copies of IAV and IBV vRNA detected from >4 μm (A), 1–4 μm (B), and <1 μm (C) airborne particles are shown.

