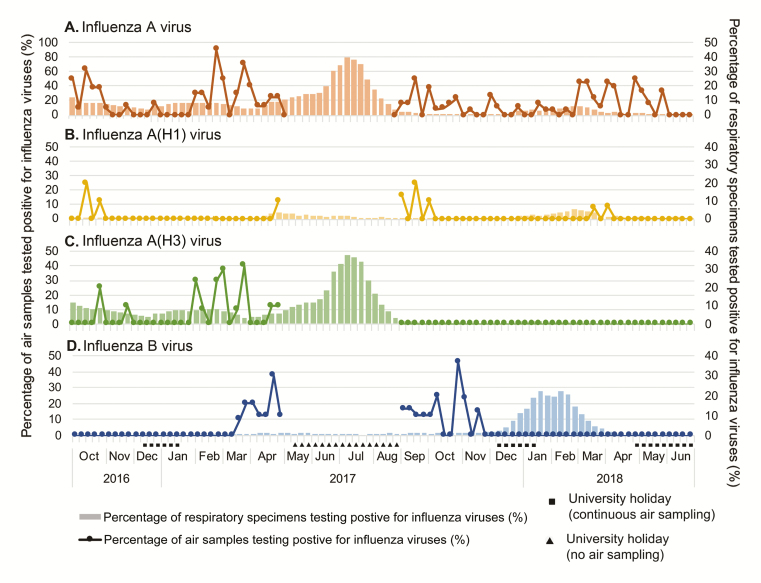
Figure 3.
Temporal relationship between detection of influenza airborne particles at a university campus vs detection of symptomatic influenza infections in the community. Air was sampled weekly at the university campus except during the summer holiday in 2017 (weeks 19–35), and the weekly positive rates for influenza A virus (IAV) and influenza B virus (IBV) in airborne particles are shown in dotted lines. The percentages of respiratory specimens testing positive for IAV and IBV from symptomatic inpatients and outpatients in Hong Kong are shown in bars (data source: Centre for Health Protection). The weekly detection frequency of IAV (A), A(H1) (B), A(H3) (C), and IBV (D) in airborne particles sampled on campus and the weekly percentage of respiratory specimens testing positive for IAV or IBV are shown.

