
Fig. 1. The anti-tumour T cell response is supported by a stem-like CD8 T cell, which gives rise to terminally differentiated CD8 T cells in the tumour.
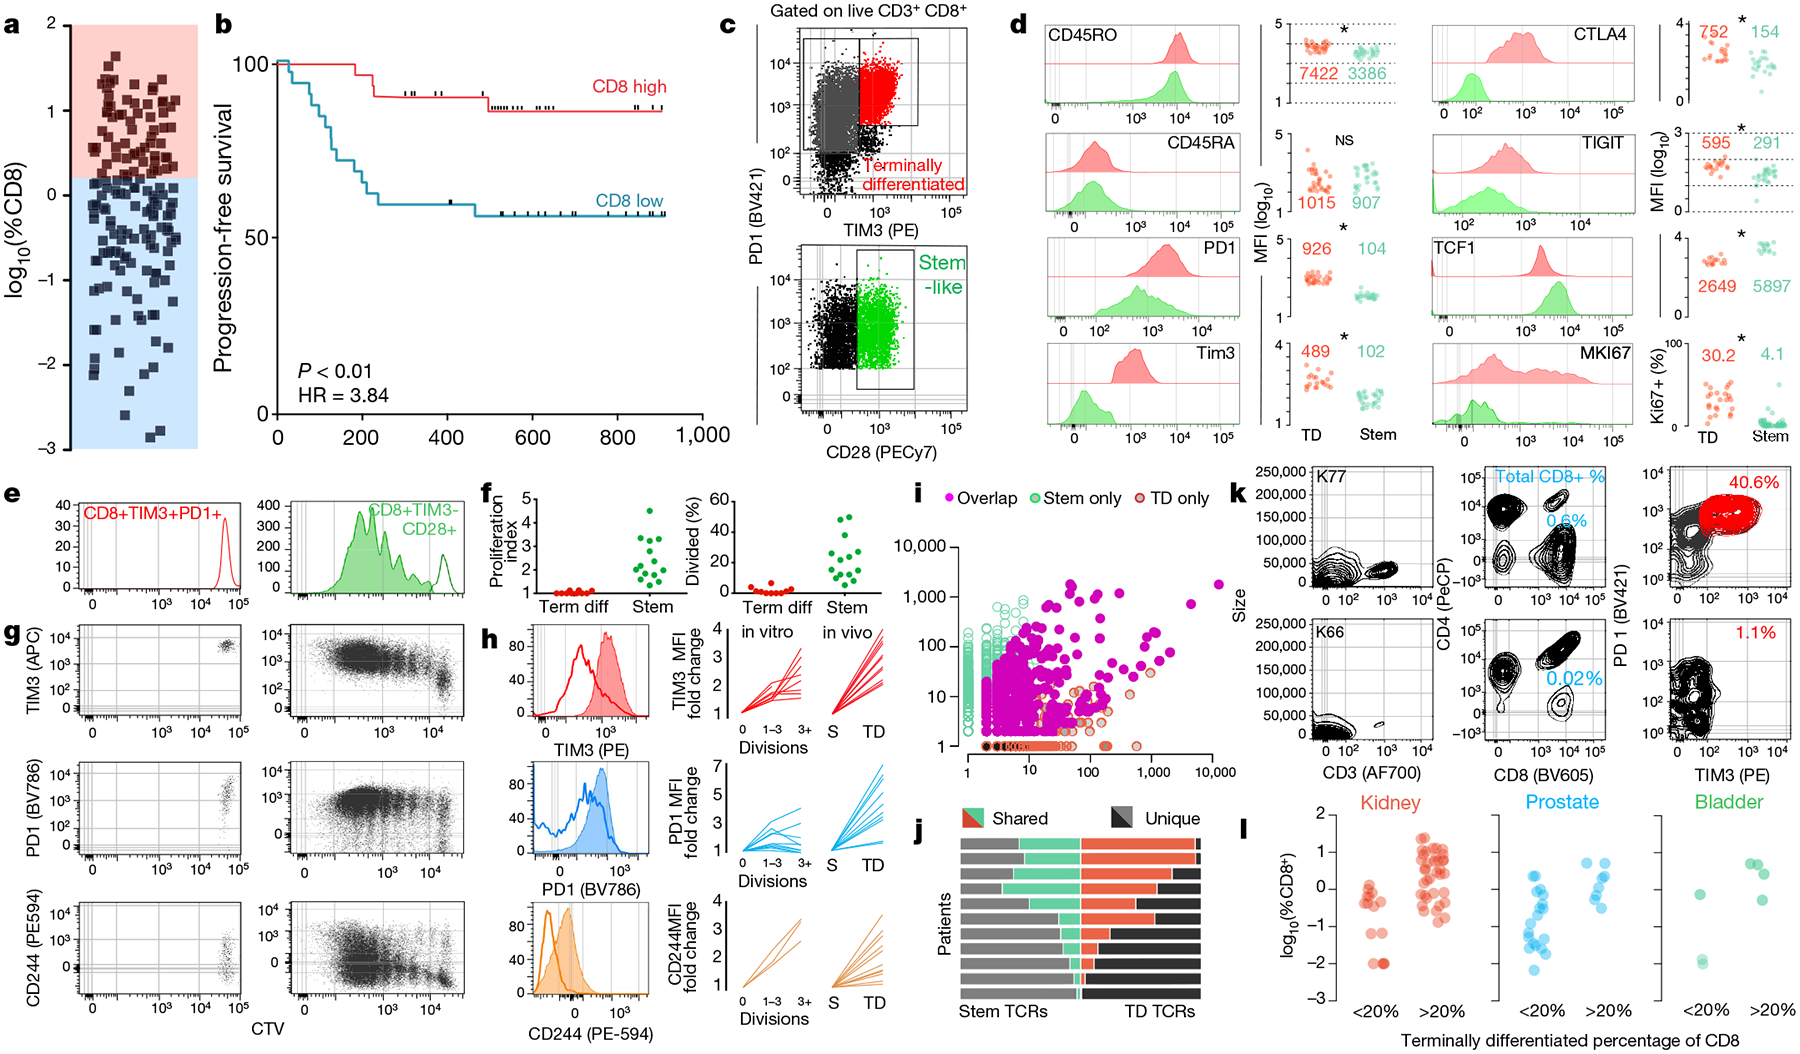
a, Proportion of CD8 T cells in kidney tumours shown as percent of total cells (n = 68). b, Disease progression after surgery in patients with kidney cancer stratified into high or low CD8 T cell infiltration (±2.2%) based on optimal cut methods. Time to progression is the number of days from surgery until death or progression by RECIST criteria (n = 66). c, Gating strategy to identify intra-tumoral CD8 T cell populations. Populations shown are gated on live, CD3+ and CD8+. d, Expression (mean fluorescence intensity (MFI)) of activation markers, checkpoint molecules and transcription factors by TIM3+ and TIM3− CD28+ subsets, gated as in c. e, f, Stem-like (TIM3−CD28+) and terminally differentiated (TIM3+) populations were sorted from kidney tumours, labelled with CellTrace violet, and cultured with anti-CD3/anti-CD28 beads and 10 U ml−1 of IL-2 for 4–5 days. Proliferation index and percentage of cells divided is shown. g, h, Expression of TIM3, PD-1 and CD244 after cells undergo proliferation. Summary plots from in vitro activation experiments compared to fold change in MFI observed between the populations in vivo. i, TCR repertoires of stem-like and terminally differentiated T cells sorted as shown in Extended Data Fig. 4. TCR clones are represented by the number of reads detected in either T cell population. j, TCR repertoire overlap between stem-like and terminally differentiated T cells. The proportion of the detected TCR repertoire in each patient that is unique to each population or shared between the two is shown. k, l, Generation of checkpoint-high cells correlates with total T cell infiltration. Patients were classified as having a low (<20%) or high (>20%) fraction of TIM3+ terminally differentiated cells. Data show sample patients (k), and summary data in kidney (n = 49), prostate (n = 28) and bladder tumours (n = 8) (l).