
Extended Data Fig. 4. TCR sequencing analysis for stem-like and terminally differentiated CD8 T cells.
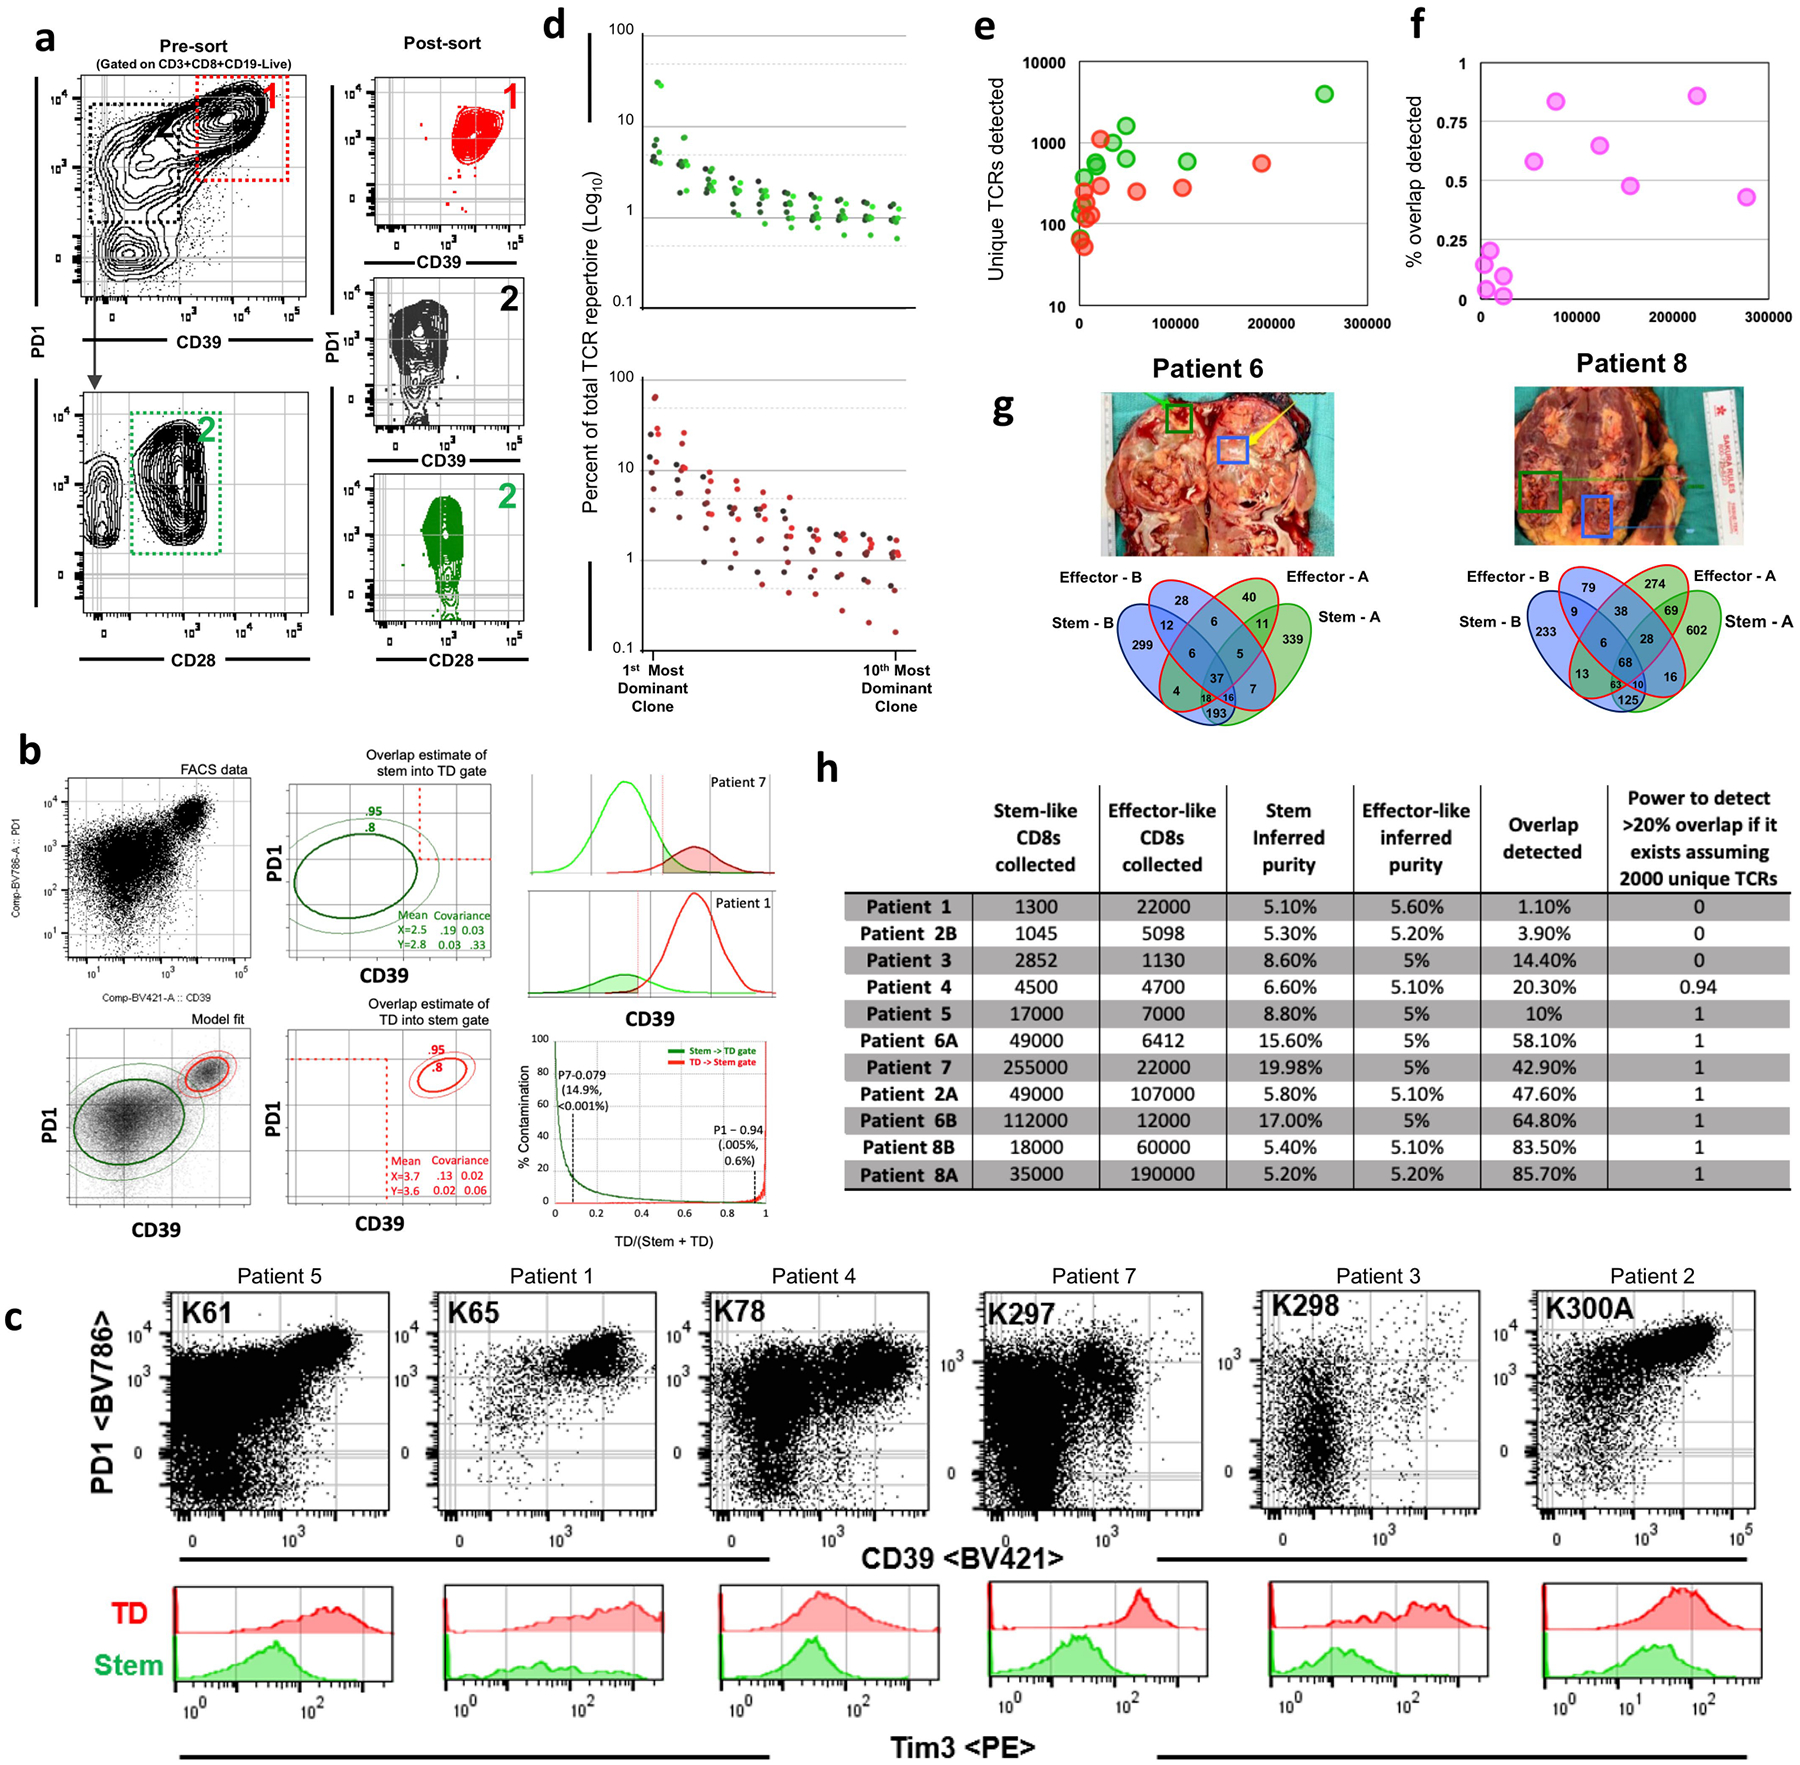
a, Gating scheme for fluorescence activated cell sorting of cell populations for stem-like and terminally differentiated cell populations from human kidney tumours. Terminally differentiated cells1 are PD-1-high and CD39+. Stem-like cells3 are PD-1+CD39−CD28+. b, Estimation of population overlap. PD-1 and CD39 expression by flow cytometry was modelled using a two-population Gaussian mixing model. The amount of each population falling within each sorting gate based on the relative proportions of the populations was determined and used to calculate whether TCRs found in both populations could be accounted for by contamination. c, Pre-sort flow cytometry plots for patients sorted for TCR sequencing. d, Ranking of stem-like (green) and terminally differentiated (red) TCR clones from most to 10th most dominant clone by percent of total TCR repertoire (log10). e, Number of unique TCR clones detected in stem-like (green) and terminally differentiated (red) cell populations as a function of number of cells collected. f, Percentage of overlap detected as a function of number of cells collected. g, Tumour samples were taken from two physically distant sites within the same tumour and stem-like and terminally differentiated cells were sorted from each and TCR sequenced. Venn diagrams illustrate unique TCRs found between stem-like populations in sites A and B, between terminally differentiated populations in sites A and B, and between location mismatched stem-like and terminally differentiated populations (for example, stem-like-A/terminally differentiated-B, stem-like-B/terminally differentiated-A), in addition to overlap between stem-like and terminally differentiated T cell populations within a single site. h, Table indicating the number of stem-like and terminally differentiated T cells collected, inferred purity of each population, percent overlap detected calculated by the number of TCRs detected in either sample divided by the total TCRs in both samples, and the power to detect >20% overlap (assuming 2,000 unique TCRs per sample) for each patient sample.