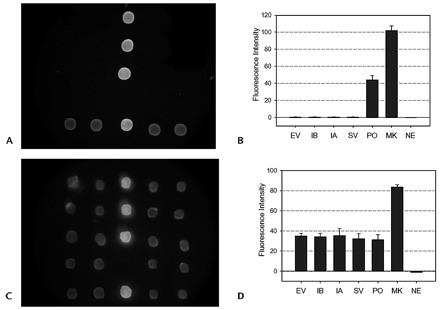
Figure 3.

Images and fluorescent intensities of the microarray-in-a-tube with complete negative samples (A, B) and complete positive samples (C, D).
From top to bottom rows, fluorescence dots represent enterovirus virus, influenza B virus, influenza A virus, and SARS-CoV positive result, respectively. From the fluorescent intensities of the probes of PO, MK, and NE, the reliability of the detection results can be checked. See legend of Fig. 2 for abbreviations.
