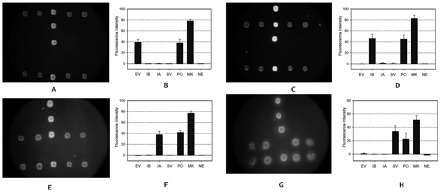
Figure 4.

Images and fluorescent intensities of the microarray-in-a-tube with single virus samples.
The nucleotide probes on the inner surface of the cap. All the probe positions are as shown in Fig. 2 . (A, C, E, G), images of fluorescence images; (B, D, F, H), plots of the fluorescence intensities of the fluorescence images. When detection was performed, the measles rubeola virus was added into the sample as the inner positive control. If the sample contained one of the viruses, the positive and the virus probe could be detected with the same fluorescence level. The images shown in A, C, E, and G are the fluorescence images of the samples of enterovirus virus, influenza B virus, influenza A virus, and SARS-CoV, respectively. See legend of Fig. 2 for abbreviations.
