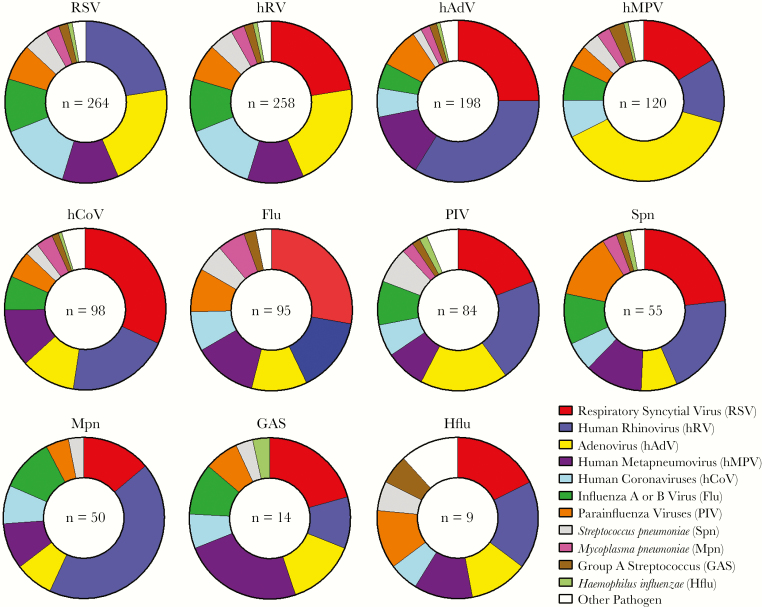
Figure 2.
Frequency of pair-wise associations between pathogens in coinfections. Pair-wise associations, by pathogen, are shown for all coinfections involving the 11 most common pathogens detected in the study; other pathogens are grouped together under “Other Pathogen” (see Supplementary Table 1 for a complete listing of all pathogens detected). A single coinfection with ≥3 pathogens present may be represented multiple times to show all associations.

