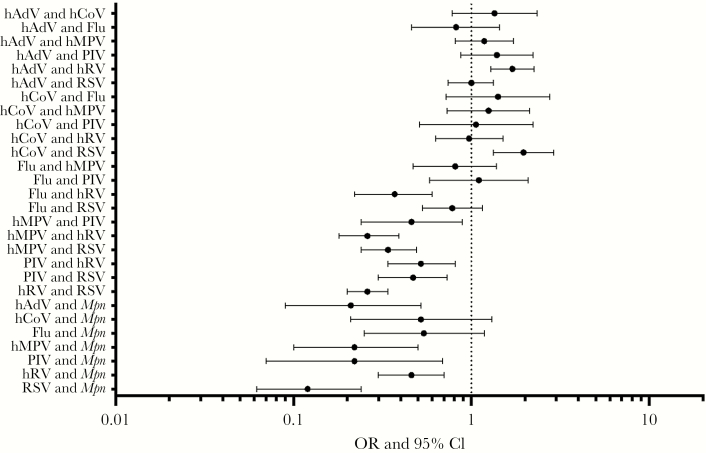
Figure 3.
Frequency of actual as compared to expected coinfections. The frequencies of commonly observed coinfection pairs are shown relative to how often they would be expected to occur by chance, using the frequencies of detection of the individual pathogens as the baseline. Deviations from expected frequencies were quantified using a χ2 test and then by calculating the odds ratio (OR) and 95% confidence interval (CI) for each pair of pathogens. Flu, influenza virus; hADV, human adenovirus; hCoV, human coronavirus; hMPV, human metapneumovirus; hRV, human rhinovirus; Mpn, Mycoplasma pneumoniae; PIV, parainfluenza virus; RSV, respiratory syncytial virus.

