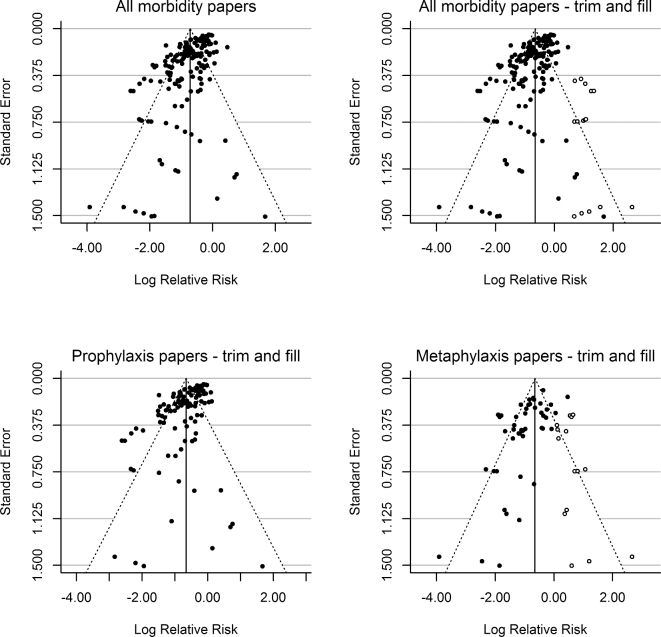
Figure 3.
Funnel plots of the morbidity data from RCTs. The upper panels show all morbidity data without (left) and with (right) Duval and Tweedie trim and fill to correct for potential publication bias (test for heterogeneity: Q (df = 168) = 1061.977, P-value < 0.0001). Published studies are represented with filled circles, where the added (fill) studies are shown with open circles. The lower panels show separate plots for prophylaxis studies (left) (test for heterogeneity: Q (df = 121) = 824.153, P-value < 0.0001) and metaphylaxis studies (right) (test for heterogeneity: Q (df = 46) = 195.687, P-value < 0.0001).

